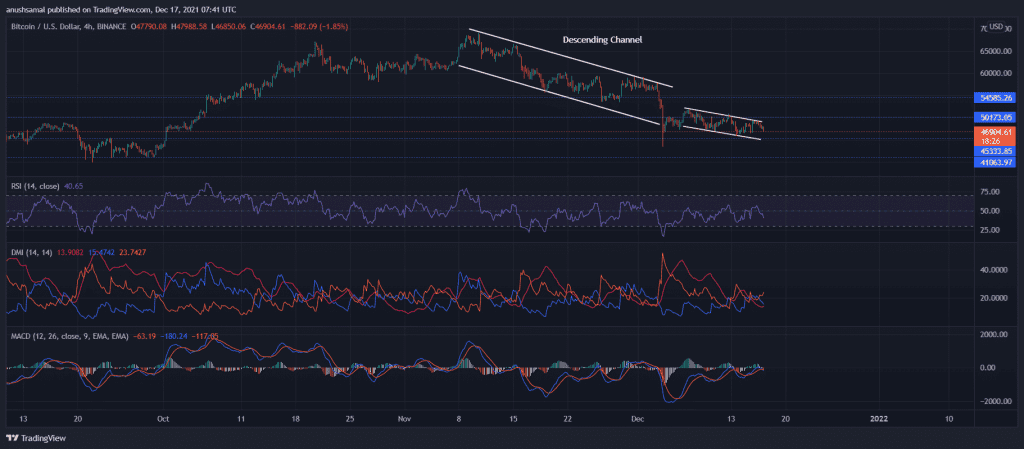
From the current technical outlook, it seems as though Bitcoin’s prices will continue to oscillate between the $50,173 and $45,333 levels, respectively.
Bitcoin had marked a decent recovery on its charts as it traded above the $50k mark. However, in the last 24 hours, the king-coin slid off its charts by 4.2% and was trading at $46,904. Bitcoin’s volatility, needless to say, produced a domino effect across the whole cryptocurrency industry.
Bitcoin had been trading within a descending channel (white) since November 8; post flashing signs of recovery in the last week, Bitcoin went back to traversing within the descending channel (yellow). The near-term technical of Bitcoin highlighted that bearish price action.
Bitcoin/BTC/USD Four-Hour Chart

The constant volatility has induced an extreme fear sentiment, leading to panic selling in the last 24 hours. Over the last couple of weeks, the intense selling pressure had caused a massive market meltdown. After trading within the descending channel, the bulls failed to sustain at the $54,585.26 price level.
From the current technical outlook, it seems as though Bitcoin’s prices will continue to oscillate between the $50,173 and $45,333 levels, respectively. For Bitcoin to invalidate the bearish force, the coin has to trade above the $54,585.26 mark, which has previously acted as a multi-month support level.
The Relative Strength Index exhibited a downturn as Bitcoin met with a sell-off. MACD’s near-term bullish pressure fell as the green histograms declined in size. The Directional Movement Index was in preference of the bears, and additionally, the ADX displayed considerable weakness.
LTC/USD Four-Hour Chart

Litecoin’s price action took a hit right after the token was trading within an ascending price channel. The token’s price made a bearish drift as the broader market witnessed an adverse price action. At the time of writing, the coin was trading for $148.10, and the token fell by 4.7% in the last 24 hours. The price of Litecoin was seen trading above its multi-week support line of $148. The bears have taken charge of the price action from the technical indicators. Immediate resistance of the coin stood at $148.41 and then at $169.05.
The local support line of Litecoin stood at $106.29. Every time Litecoin embarked on a path of recovery, buyers had flocked the market. However, as prices moved within the descending channel, selling pressure had taken over the market, as seen on the Relative Strength Index. If prices remain below the 20-SMA line, the LTC’s prices could register a 33% fall. The Squeeze Momentum Indicator continued to display that the market was in a squeeze condition.
ETH/USD Four-Hour Chart

Ethereum’s current price was on a reversal after trading in an up-channel for the past few months. Ethereum’s prices have been dominated by the bears for most of this month. At press time, the alt-king traded at $3840.89 after registering 4.9% depreciation over the last 24 hours. The immediate support level stood at $3243.25, and Ethereum struggled to move over the $4646.29 resistance level. As the altcoin fell on its charts, it met with a sell-off over the last multiple weeks. The immediate price resistance stood at $3868.14 and then at $4251.14.
Ethereum’s price run has been halted several times as panic selling occurred sporadically throughout November and December. If selling pressure precedes buying strength, the coin can rest at $3243.25. The Relative Strength Index was on a downtrend. The Directional Movement Index indicated that the bearish trend would gain strength over the coming trading sessions. MACD displayed red histograms, which agreed with the bearish price action.