As the market condition over the past 24-hours resonated with the bears, altcoins like XRP, MATIC and Terra saw losses on their daily charts. While XRP bounced back from its bullish trendline, MATIC and LUNA struggled to hold their immediate supports.
XRP
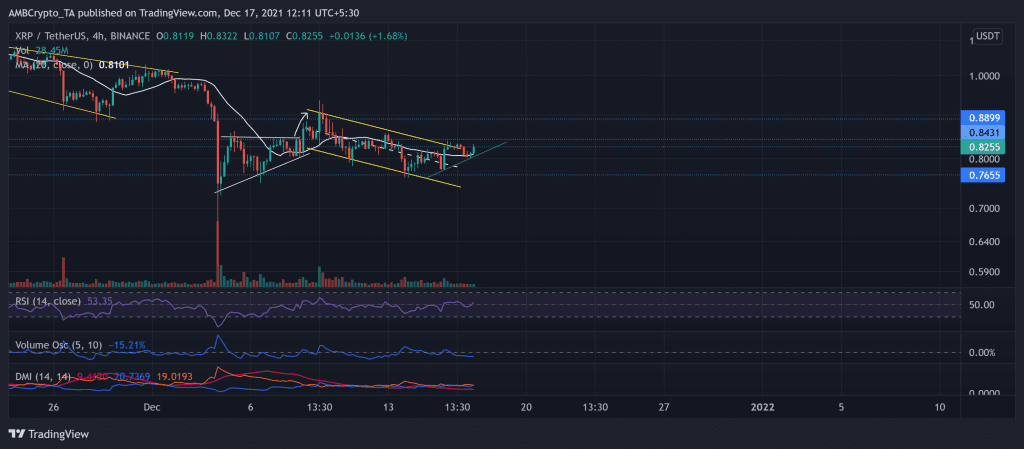
As XRP saw a down-channel breakout on 16 December, the bears quickly triggered a pullback. But the 20-SMA stood as strong support as the alt saw a couple of green candles from the $0.8-mark.
For over a week, the bulls attempted a breakout of the $0.84-mark after retesting it multiple times. XRP has been on a downtrend since 10 November now, after noting a nearly 39.14% decline since then. Thus, it became difficult for the bulls to find a trend-altering impetus.
However, the RSI seemed hopeful for them as it swayed above the half-line. But the Volume Oscillator depicted that the recent bull move was on rather decreasing volumes. At press time, XRP traded at $0.8255. Although the DMI lines closed in a bullish crossover, the ADX displayed an exceptionally weak directional trend.
MATIC

TradingView, MATIC/USDT
MATIC also witnessed a down-channel breakout on 15 December. Now, it moved between two parallel lines heading north. The $2.195-mark stood as a strong resistance for the bulls to conquer. Consequently, the price action saw a pullback after noting a 2.3% 24-hour loss.
However, holding the 2.065-level was crucial for the bulls to prevent a further breakdown. Also, the lower parallel channel (yellow) coincided with this level.
While the long-term trend for the alt remained bullish, it oscillated sideways for the past two weeks.
At press time, MATIC traded at $2.038. The RSI headed south after losing its thrust. Although the MACD lines waved above the equilibrium, they implied a decreasing bullish influence. Nevertheless, the ADX displayed a weak directional trend for MATIC. While the pullback occurred on low volumes, it kept the bullish revival hopes alive.
Terra (LUNA)

TradingView, LUNA/USDT
LUNA invalidated a flagpole and bullish pennant pattern after a breakdown that transposed in a down-channel (yellow). This fall noted a 25% loss from 10 to 14 December, depicting an increased bearish vigor. But the 61.8% Fibonacci support continually stood as a strong hurdle for the bears.
Over the past three days, the alt recovered its previously lost value and now found support at the 38.2% Fibonacci level. Meanwhile, it became the eleventh-largest crypto in terms of market cap.
At press time, LUNA traded at $62.76 after noting a 2.3% 24-hour loss. The RSI seemed to head south after a brief uptrend. Also, the DMI affirmed a slight bullish preference. The AO projected the 24-hour decline by flashing a red signal. Nevertheless, LUNA’s directional trend stood weak as per the ADX (red).