The Metaverse fanbase is increasing day by day, and as the new year approaches, the industry seems to be having even a brighter future ahead. Today, the major Meta token showed a positive price movement from their crucial support, trying to initiate a new rally.
MANA Token Price Gave Bullish Breakout From Falling Channel Pattern

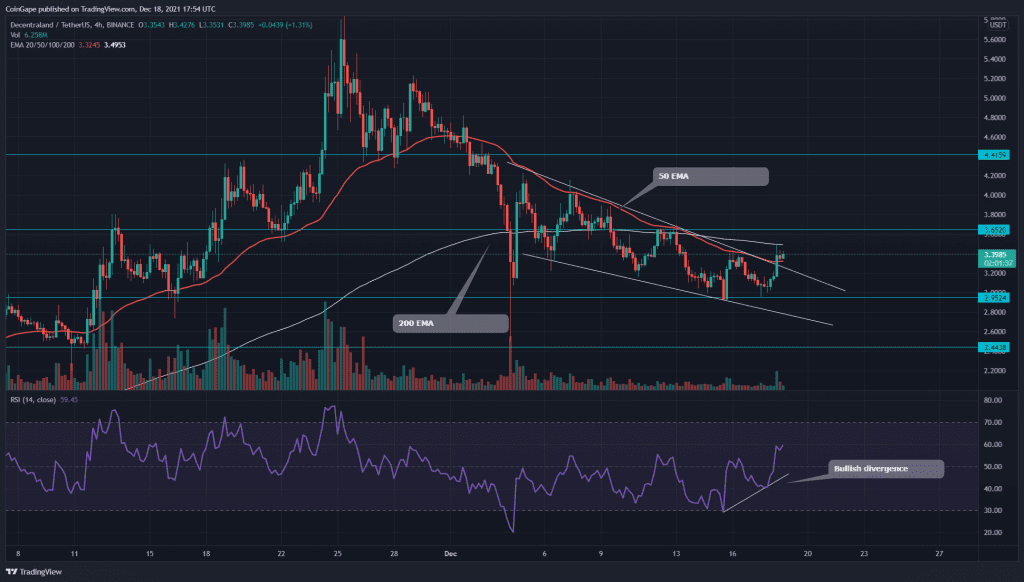
Source- MANA/USD chart by Tradingview
The recent correction phase in the MANA token brought around a 50% discount for the crypto investors, lowering its price to a psychological value of $3. Moreover, the technical chart reveals a falling channel pattern in the 4-hr time frame chart.
Today the price surged around 12%, resulting in a bullish breakout from the price pattern. The token price is currently in a retest phase which should provide a great entry opportunity and validate if the breakout was genuine or not.
On a contrary note, the 200 EMA and $3.65 resistance levels are quite close to the price, and therefore, the safe traders can wait for the price to breach this level for better confirmation of a rally.
The Relative Strength Index(60) displayed an impressive recovery cornering the token’s price action.
SAND/USD Chart Displayes A Short Consolidation In The Price
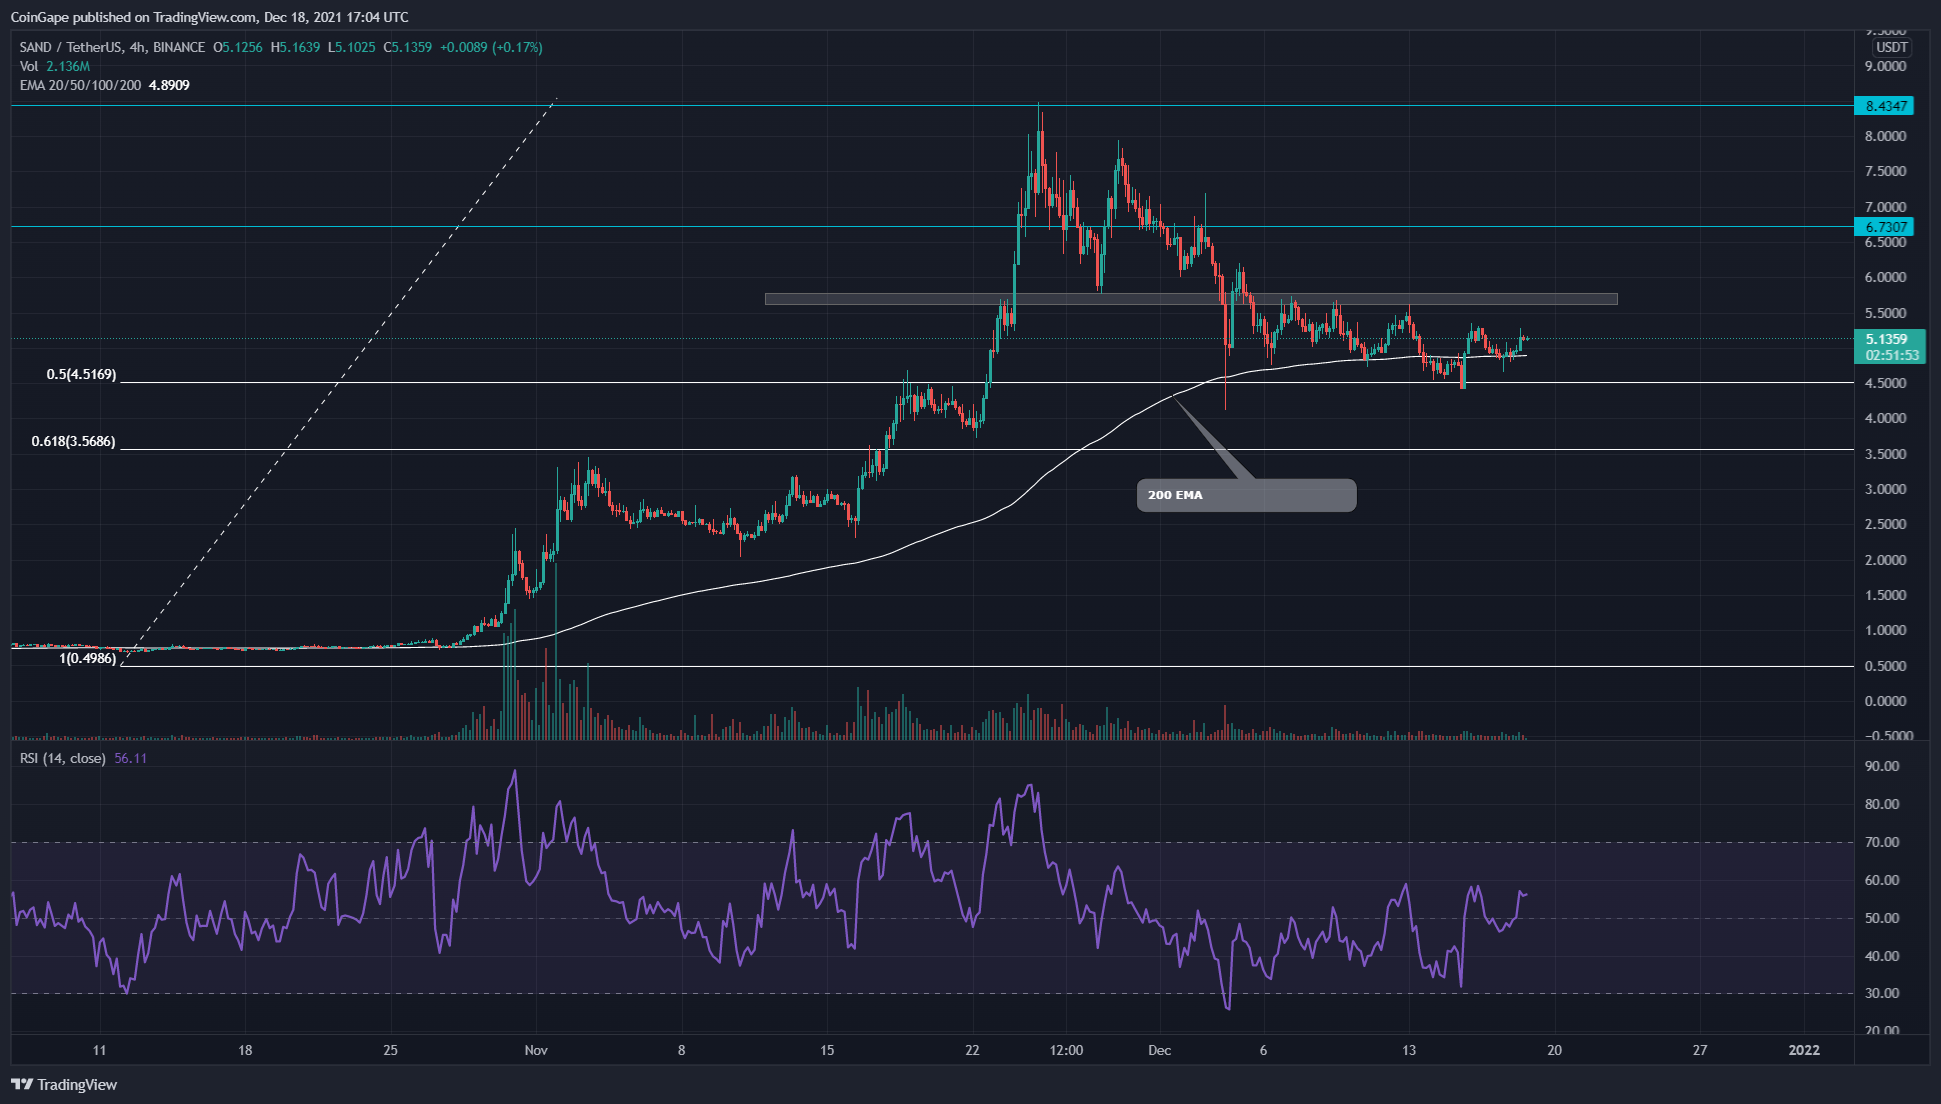
Source- SAND/USD chart by Tradingview
The last time when we covered an article on SAND/USD, the token price was under a correction phase which plunged its price to the 0.5 Fibonacci retracement level($4.5). The pullback cost a negative 40% for the crypto investors, where the coin price is currently trying to sustain above the support level.
It has been almost two weeks since the price is resonating between the $5.7 and $4.5 mark, creating a narrow range in this chart. The crypto trade could grab a great entry opportunity once the price breakouts from either level of this range.
However, the Relative Strength Index(56) indicates a significant bullish divergence in its chart, suggesting a bullish breakout from the range.
ENJ/USD Price Resonates In A Falling Wedge Pattern

Source- ENJ/USD chart by Tradingview
The last time when we covered an article on ENJ/USD, the token price was trying to sustain above the $3.5 support. However, the overpowered bears dropped the price below this support, indicating a deeper correction phase.
Later the token price plunged to the $2.2 support, projecting a 55% loss in its value. Furthermore, the chart shows a falling wedge pattern formation in the 4-hour time frame chart. The price is still resonating between two descending trendlines of this pattern, preparing for it a strong breakout from either of these lines.
Moreover, The Relative Strength index(56) indicates a strong bullish divergence in its chart, suggesting a bullish breakout from the price pattern.