Dogecoin’s price recorded a massive pullback from its very recent 16% hike. The meme-coin has previously succumbed to such pangs of sharp volatility owing to Elon Musk’s infamous tweets.
The near-term technicals have pointed towards decreasing buying pressure. The coin’s bearish pressure again resurfaced owing to the recent selling pressure that Dogecoin had encountered.
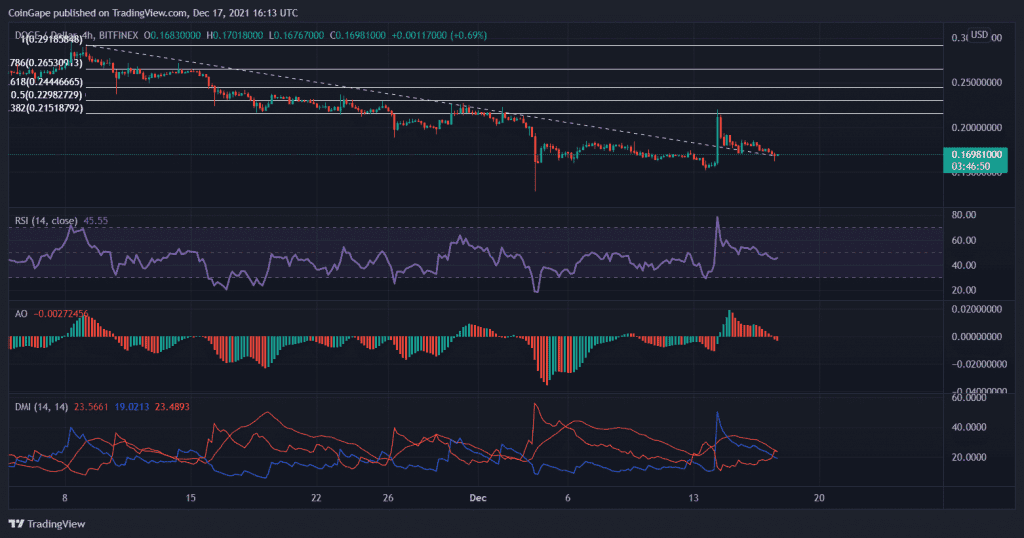
Dogecoin/USD Four-Hour Chart

Dogecoin’s solid pullback from the 38.2% Fibonacci level. The coin encountered a17% decline ever since Doge’s short-lived rally. At press time the coin was priced at $0.169. The immediate support level for the coin stood at $0.215, as evidently seen by the number of times bulls were rejected from the level. In case of a further breakdown in Doge’s prices, the local price floor awaited the coin at $0.160.
The Relative Strength Index slipped below the half-line as the buyers exited the market. Awesome Oscillator affirmed the bearish thesis and also highlighted a selling bias. The Directional Movement Index displayed bearishness which sided with the broader market trend.
SHIBA/USD Four-Hour Chart

Shiba Inu’s price action slackened since the beginning of December, and the coin was consolidated over the last few weeks. The vital support level for the coin stood at $0.000030, while the immediate resistance was at $0.000040. Going by the broader market trend, the coin has formed a descending triangle which might extend to a further bearish price movement. A further descend in prices might cause the coin to invalidate its multiple long support line and trade at $0.000024.
Technicals of SHIB were in agreement with the consistent bearish move of the coin. The Relative Strength Index travelled further south post losing a couple of points in the last trading sessions. Correspondingly, Awesome Oscillator or MACD pointed towards exiting buying strength, according to the indicator mentioned above. The Directional Movement Index showed bearish biasedness.
MATIC/USD Four-Hour Chart

MATIC traded for $2.12 after it declined by 5.9% over the past 24 hours. The coin was trading close to the immediate resistance of $2.20. The altcoin was trading in a descending channel, and with continued bearish movement, the support region stood at $1.78. Over the past few days the coin had regained some of its strength back, but the coin fell back into its bear pit.
Despite a fall in prices, the Relative Strength Index rose above the midline, which pointed towards chances of MATIC reversing its price action. Although Chaikin Money Flow remained in the negative territory as capital inflows didn’t revive themselves over the last trading sessions. Although the red histograms were declining, the awesome Oscillator projected bearish price action to signal a possible price reversal.