With the Bitcoin fear and greed index flashing an ‘extreme fear’ situation over the past week, the resulting impact can be seen on most cryptos. XRP flashed weak technicals while Tron and BitTorrent lost their crucial price points that the bulls upheld for months.
XRP
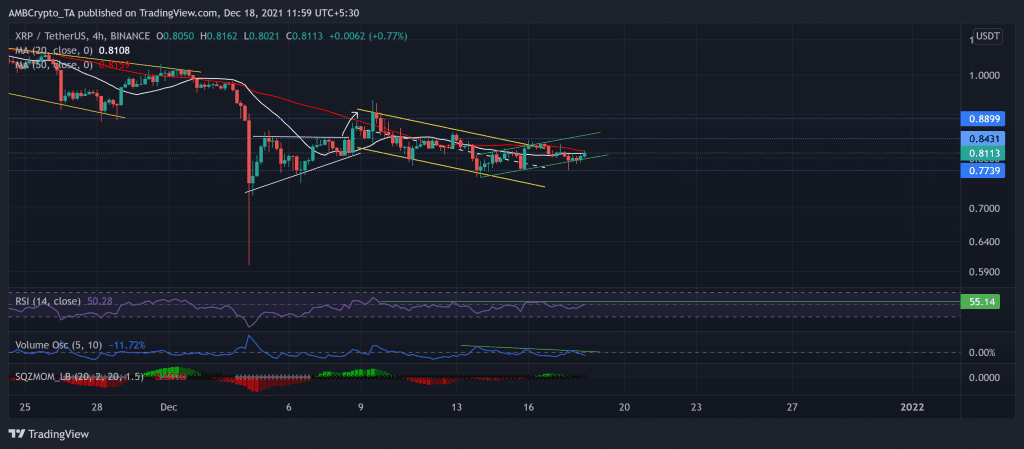
Since 7 December, XRP has found an oscillating range between $0.88 and the $0.77-mark. The Squeeze Momentum Indicator continually flashed black dots and resonated with the consolidation tendencies.
After an ascending triangle breakout on 8 December, the bulls broke above the $0.88-level but quickly dipped below the 20-50 SMA lines. This fall witnessed a down-channel (yellow)on its 4-hour chart.
Over the past week, the 50 SMA stood as a good resistance as the price action practically swayed below it after testing it multiple times. Now, if the price action breaches the above level, it might see a subtle resistance at $0.84 which stood as an immediate testing point for the bulls.
At press time, XRP traded at $0.8113 after noting a 25.9% 30-day decline. Over the past nine days, the RSI struggled to cross the 55-mark. Also, the Volume oscillator marked lower highs, indicating a weak bullish move.
Tron (TRX)

Source: TradingView, TRX/USDT
TRX witnessed a symmetrical triangle breakdown over the last day while the fear sentiment surged. This fall was in anticipation due to a previous double-top downfall on 4 December. Further, the price action noted a long red candle on 17 December following the news of Justin Sun stepping down from his duties at the Tron Foundation.
The bears displayed their vigor as TRX saw an over 9% fall in just two days. The altcoin lost the crucial $0.82-level, which the bulls upheld for over four months. As a result, it dipped toward the $0.078-mark for the third time in 18 weeks. No surprise to see the Supertrend being in the red zone and flashing sell signals.
At press time, TRX traded at $0.0805. The RSI moved sideways after falling into the oversold region. The OBV wavered around its seven-week low and reaffirmed the decreased buying pressure.
BitTorrent (BTT)

Source: TradingView, BTT/USDT
BTT persistently slackened after poking the $0.004198 on 8 December. The alt oscillated in a down-channel (white) for the past days and noted a 36.6% downfall during this time.
The altcoin lost the crucial $0.003088 (immediate resistance) that the bulls upheld for nearly 19 weeks. This breakdown halted at $0.002609, which also was the neckline for the previous double-bottom breakout. Consequently, the price action bounced back from that level after the bears retested it thrice.
At press time, BTT traded at $0.00266. The RSI chose the bears and marked lower highs since 7 December. Also, the DMI and MACD lines skewed in favor of the bears.