The ETH coin indicates that the overall trend is still bullish. However, the pair is stuck in a correction phase and has discounted the coin by 20%. Furthermore, a falling wedge pattern is leading this short-term downtrend, and the coin will follow a red flag until this pattern is intact.
Key technical points:
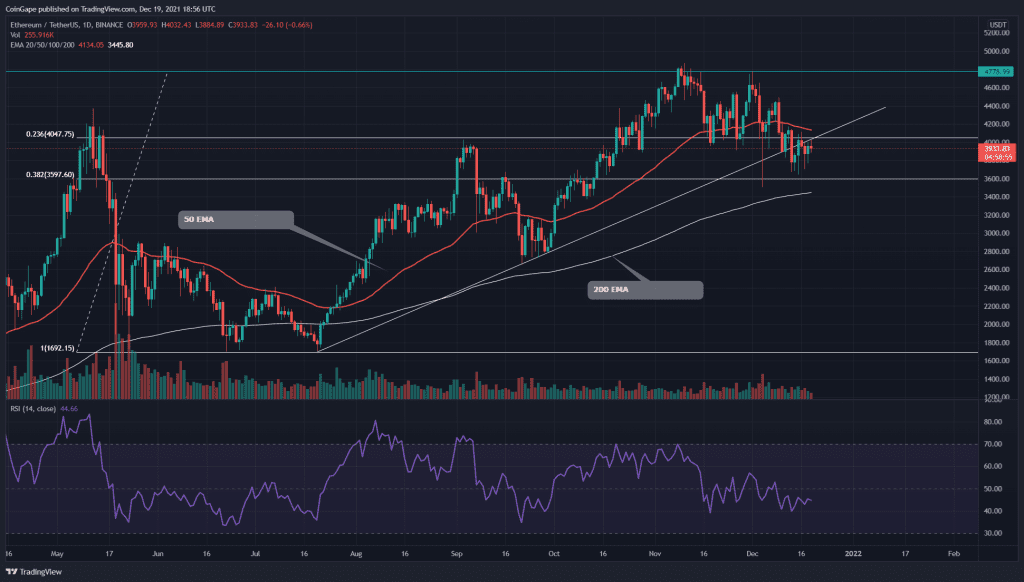
- The ETH coin chart shows a bearish crossover of the 20-and-50-day EMA
- The intraday trading volume in the ETH coin is $2.13 Billion, indicating a 6.12% loss.
 Source-Tradingview
The last time when we covered an article on ETH/USD, the coin price was still hovering above the $4000, trying to obtain sufficient support from it. However, on December 13th, the overpowered sellers caused a decisive breakdown from this crucial level, extending the correction phase for the long holders.
So far, this pullback has cost 20% from the All-Time High of $4875 and is currently retesting the new resistance before beginning a red rally.
The ETH coin maintains a bullish trend as long the price moves above the trend defining 200 EMA. However, this retracement has already engulfed the 20, 50, and 100 EMA lines. Moreover, the 20 and 50 provided a bearish crossover, encouraging even more sellers in the market.
The daily Relative Strength Index (44) displays a sideways rally in its chart, indicating no clear dominance from either party.
ETH/USD 4-hour time frame chart

Source-Tradingview
The ETH coin technical chart shows a falling wedge pattern in the 4-hour time frame chart. This pattern leads the correction rally from the ATH resistance of $4478. Currently, the pair indicates another bearish reversal from the descending trendline, which could plunge its price to the support trendline.
On the contrary, a falling wedge is quite known for a strong upwards rally when the price breaches the resistance trendline, providing the crypto traders with an excellent entry opportunity for a long trade.
The traditional pivot suggests the nearest resistance level for ETH price is $4152 and $4647 to play an important role. Whereas the support levels are at the $3800 and $3488 mark.