From the later half of December 2021, the Hedera coin was trying to recover from its previous correction. However, the price couldn’t surpass the $0.329 resistance, resulting in a bearish reversal. The technical chart shows a double top pattern, which could extend the ongoing selling.
Key technical points:
- The HBAR coin seller engulfed the 200-DMA line
- The intraday trading volume in the Hedera coin is $178.1 Million, indicating a 24.1% loss.
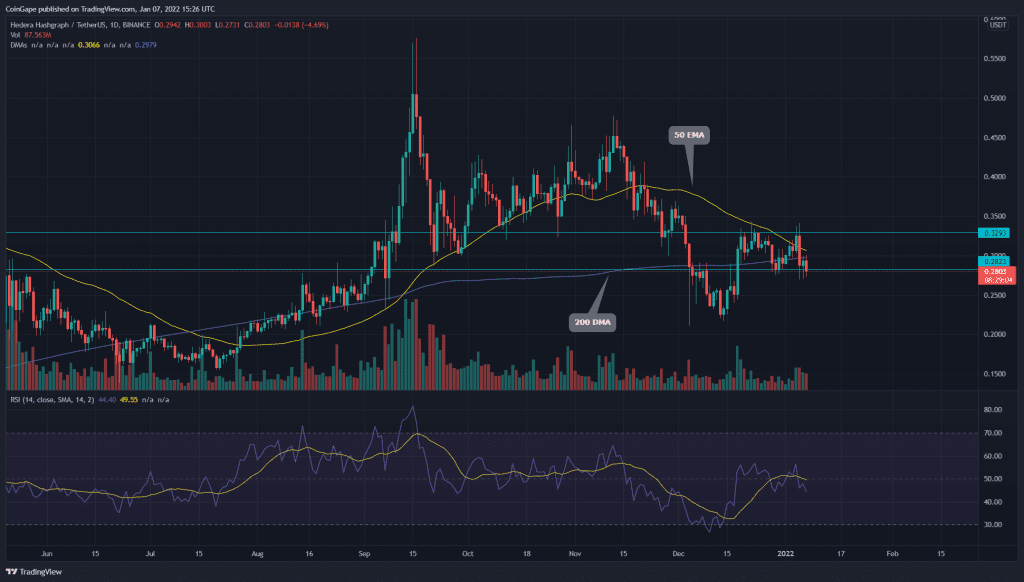
 Source- Tradingview
Previously when we covered an article on the Hedera coin, this pair gave a massive breakout from a long coming resistance trendline and the $0.28 horizontal level. Even though the price managed to sustain above the breakout level, the buyers couldn’t breach the $0.323 resistance.
The coin tried several attempts to breach this overhead resistance; however, the intense supply pressure restricted the price to go ahead. Moreover, the recent bloodbath in the crypto market fueled the selling activity and plunged the price to $0.285 support.
The 200-day EMA line has been in confluence with the $0.285; thus, similar to the price action the coin couldn’t hold above this trend defining EMAs as well. The price is trading below the crucial DMAs(20, 50, 100, and 200), projecting a bearish trend.
The daily Relative Strength Index (68) slips below the neutral line and 20-SMA, indicating a bearish sentiment in the price.
Hedera Coin Displays A Double Top Pattern

Source- Tradingview
A second rejection from the $0.323 resistance formed a double top pattern in the 4-hour time frame chart. Currently, the coin price is trying to breach this neckline support of $0.285. The crypto traders should wait for a daily-candle closing below this level, providing them a short trade opportunity in this coin.
The super trend indicators accentuate the down rally in HBAR price.
The technical chart indicates important resistance levels for this coin are at $0.323, followed by $0.367. As for the opposite side, the support levels are $0.28 and $0.21.