In this article, BeInCrypto will take a look at several potential Bitcoin (BTC) wave counts, in order to determine what is the most likely movement during the coming weeks.
Bearish scenario
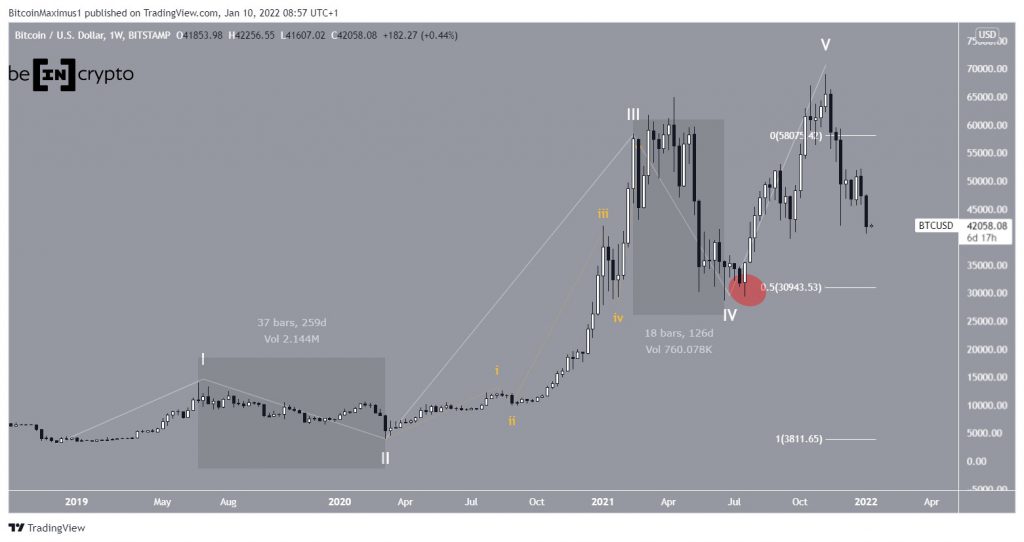
The most bearish BTC count suggests that the five wave upward movement that began on Dec 2018 ended with the all-time high price of $69,000 on Nov 2021.
In the five wave formation (white), wave three is the one that is extended, hence being the longest. Wave four ended after a bounce (red circle) at the 0.5 Fib retracement support level at $31,000.
The main issue with this count is the difference in length between waves two and four (highlighted). While the former took 259 days to develop, the latter developed in only half that time.
However, while this is not a textbook length ratio between the two waves, it is still a valid formation.
Bullish scenario
The most bullish scenario does in fact have several similarities with the most bearish one. In fact, the entire movement up to the beginning of wave five is identical.
However, similarly to how wave three extended in the bearish scenario, wave five has extended in this one. The sub-wave count is given in yellow.
What this means is that the entire movement since July 2020 is part of sub-waves one and two. In this case, the rate of increase of BTC would greatly accelerate towards a new all-time high.
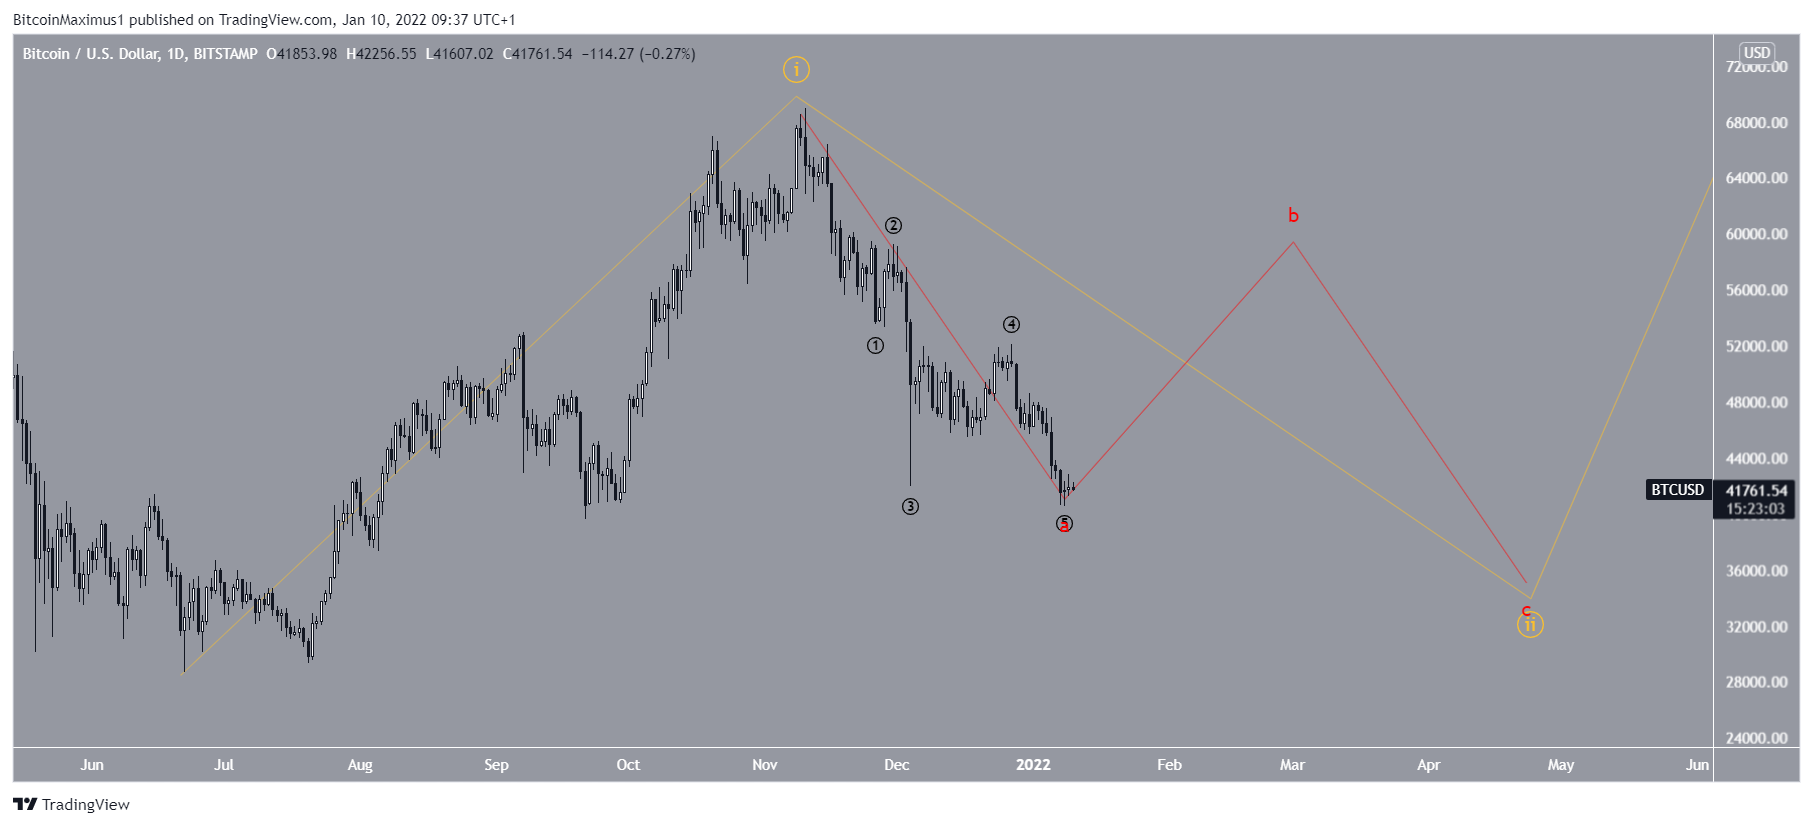
The main issue with this count is the length and shape of sub-wave two, which does not look like a correction. Therefore, in order for this count to be the correct one, BTC has to still be creating that sub-wave two.
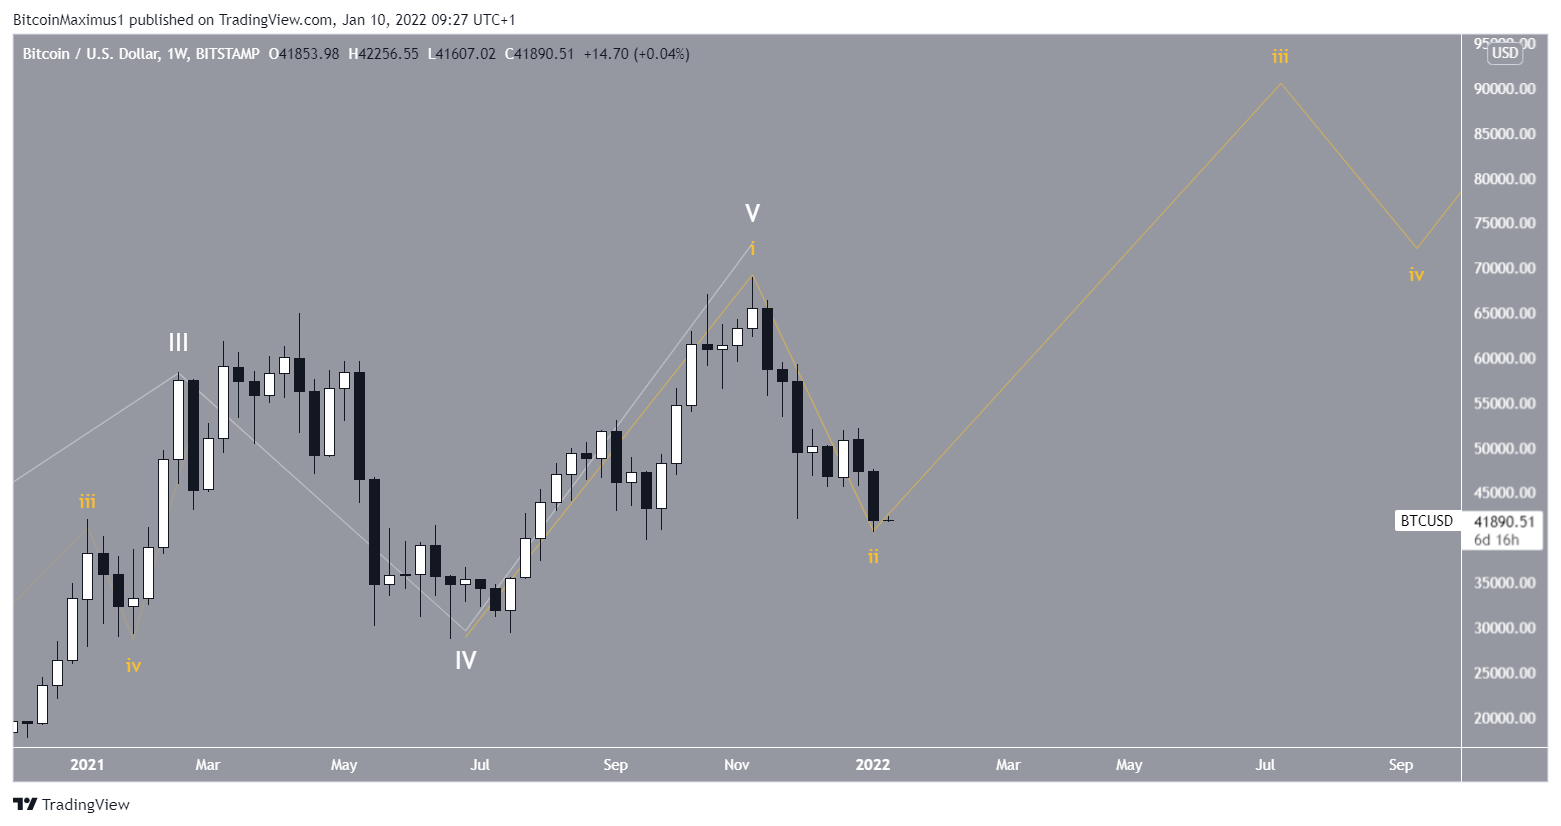
So, it would mean that the decrease is wave A of an A-B-C corrective structure (red). Therefore, after a considerable bounce, BTC would fall and make yet another low.
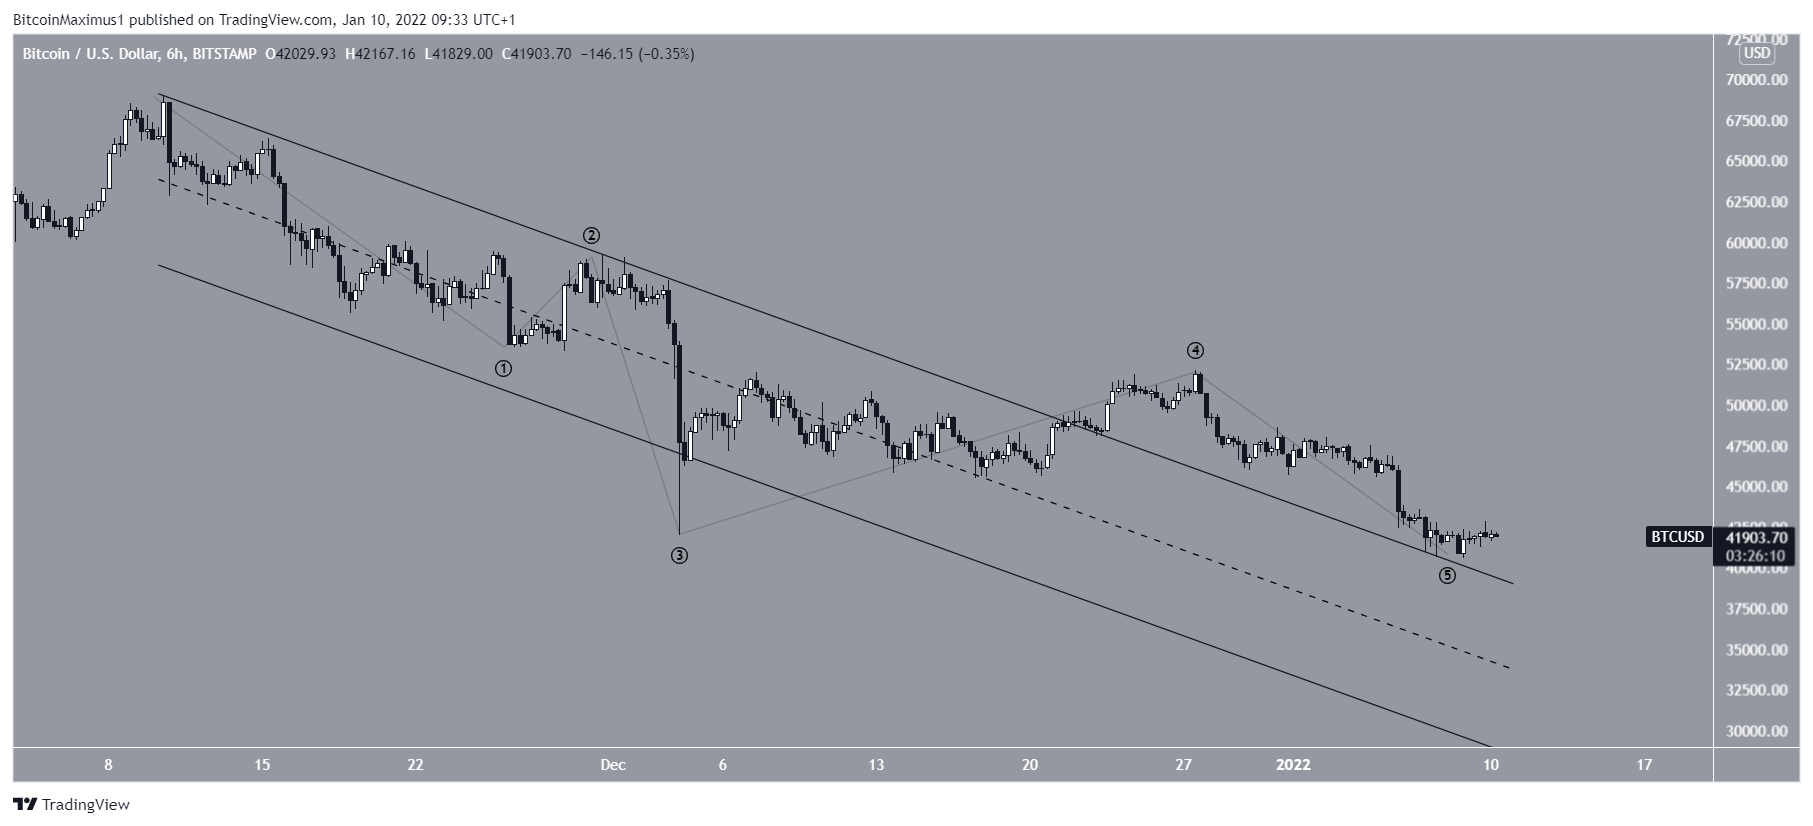
The reason for this not being a regular correction is the fact that the movement is not contained inside a descending parallel channel.
Most likely count
Cryptocurrency trader @TheTradingHubb tweeted a BTC chart, stating that the price has been mired in a correction since the Nov 2021 all-time high price.
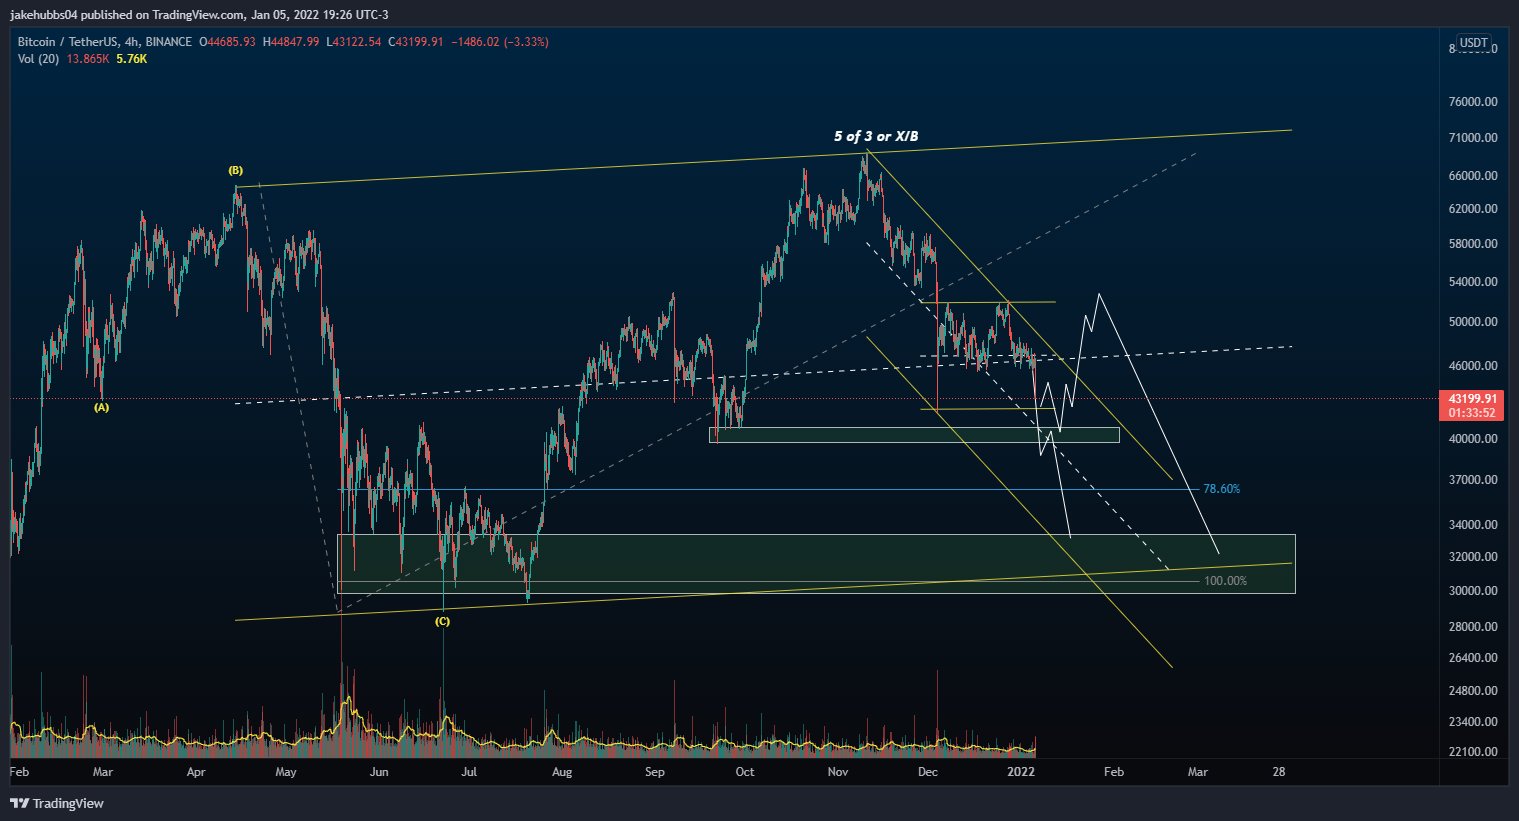
Besides the previously outlined scenario, there is another potential formation that is still valid.
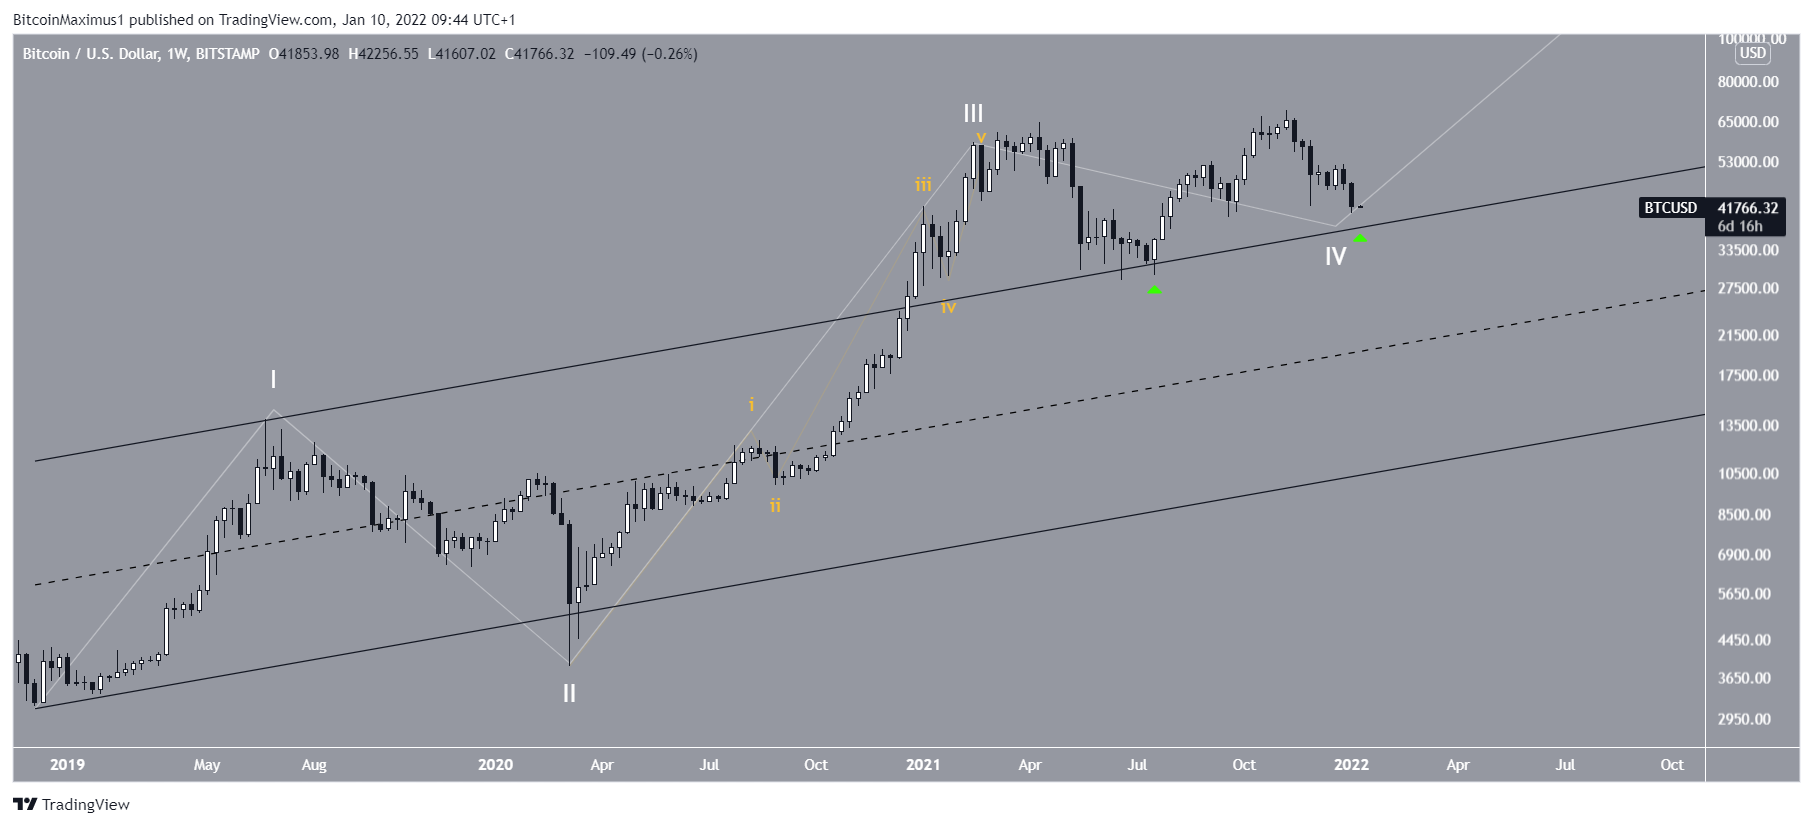
It would make sense that BTC would still be in the long-term wave four (white) as outlined in the first section. This would also fix the issue with the length between waves two and four.
in July, BTC bounced at the resistance line of a previous ascending parallel channel (green icon). Another drop would validate the line once more, hereby completing the entire correction.
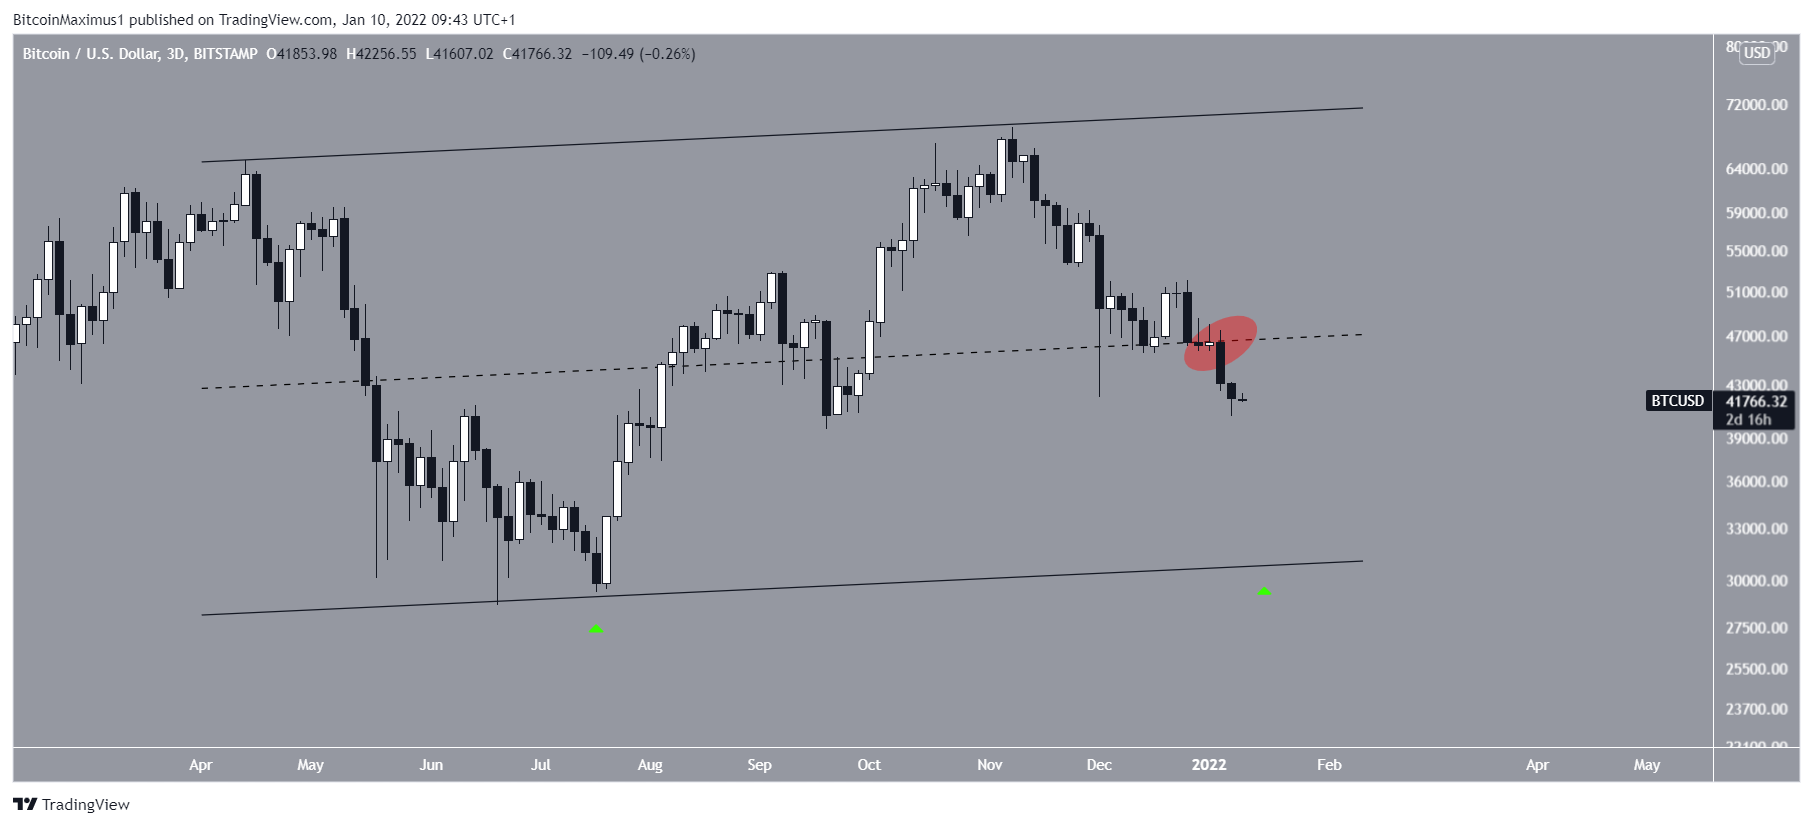
The shorter-term movement is presented below. In it, BTC has fallen below the middle of an ascending parallel channel (red circle).
In this scenario, BTC could fall all the way to the low $30,000s before reversing trend.
For BeInCrypto’s latest Bitcoin (BTC) analysis, click here.
Disclaimer
All the information contained on our website is published in good faith and for general information purposes only. Any action the reader takes upon the information found on our website is strictly at their own risk.

