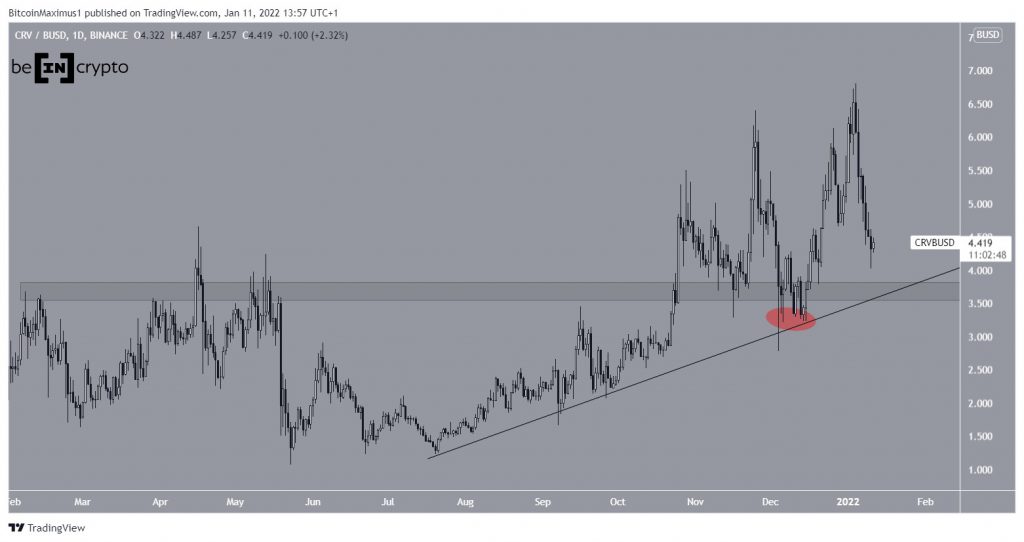
The bullish structure for Curve DAO Token (CRV) remains intact as long as the token is trading above the $3.70 area, which is now acting as support.
On Oct 25, CRV broke out from the $3.70 horizontal resistance area, which had previously been in place since Feb 2021. It proceeded to reach a high of $6.80 on Jan 4.
After breaking out, CRV validated the $3.70 horizontal area as support. While it deviated below it on Dec (red circle), it reclaimed the area shortly afterwards and resumed its upward movement. Such deviations are considered bullish developments, since the previous breakdown could not be sustained.
In addition to this, the token is following an ascending support line that currently coincides with the $3.70 support area.

Future movement
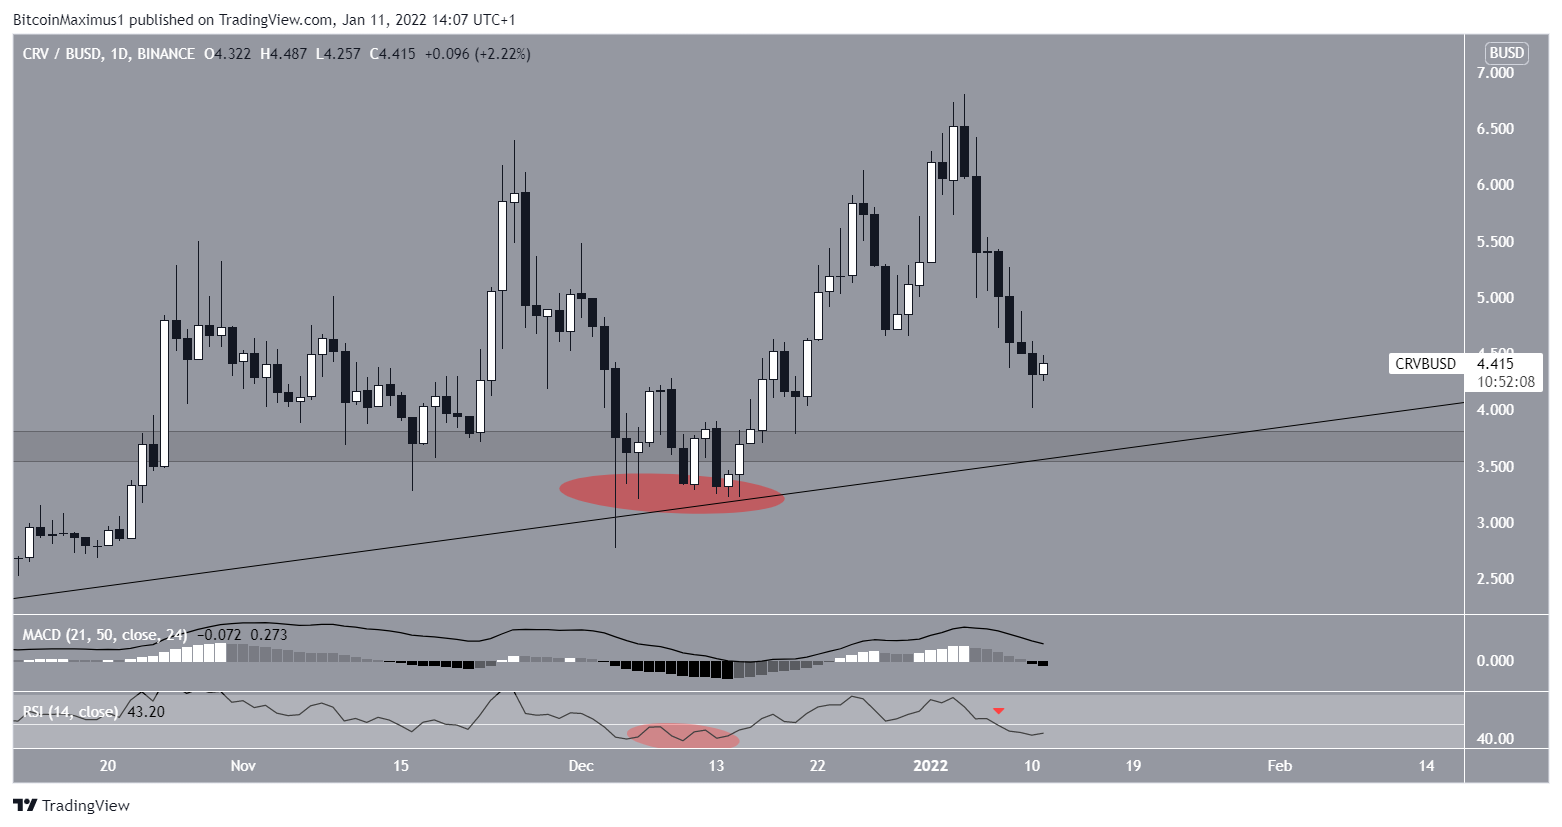
Technical indicators in the daily time-frame are relatively bearish, since both the RSI and MACD are falling.
The RSI is a momentum indicator, and readings below 50 (red icon) are considered bearish. It remains to be seen if the current decrease will turn out to be only a deviation, similar to what transpired in Dec (red circle).
The MACD, which is created by a short- and a long-term moving average (MA) is also nearly negative. A cross into negative territory would be a bearish development.

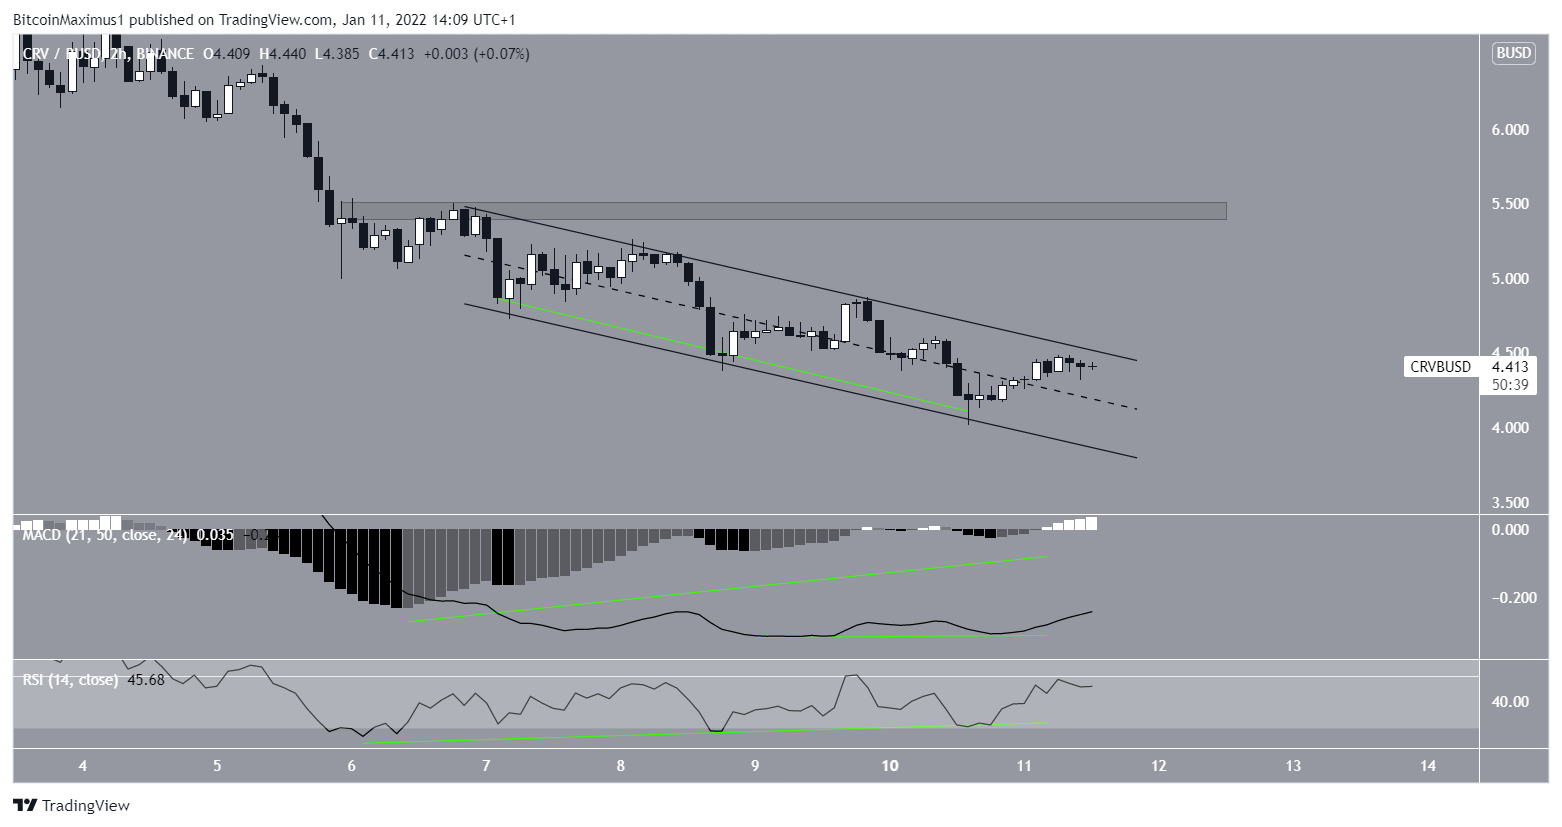
The two-hour chart shows that CRV is trading inside a descending parallel channel. Such channels are usually considered corrective patterns, meaning that a breakout from them would be expected.
Furthermore, both the RSI and MACD have generated significant bullish divergences, supporting the possibility of a breakout.
If one occurs, the closest resistance area would be at $5.45.
CRV/BTC
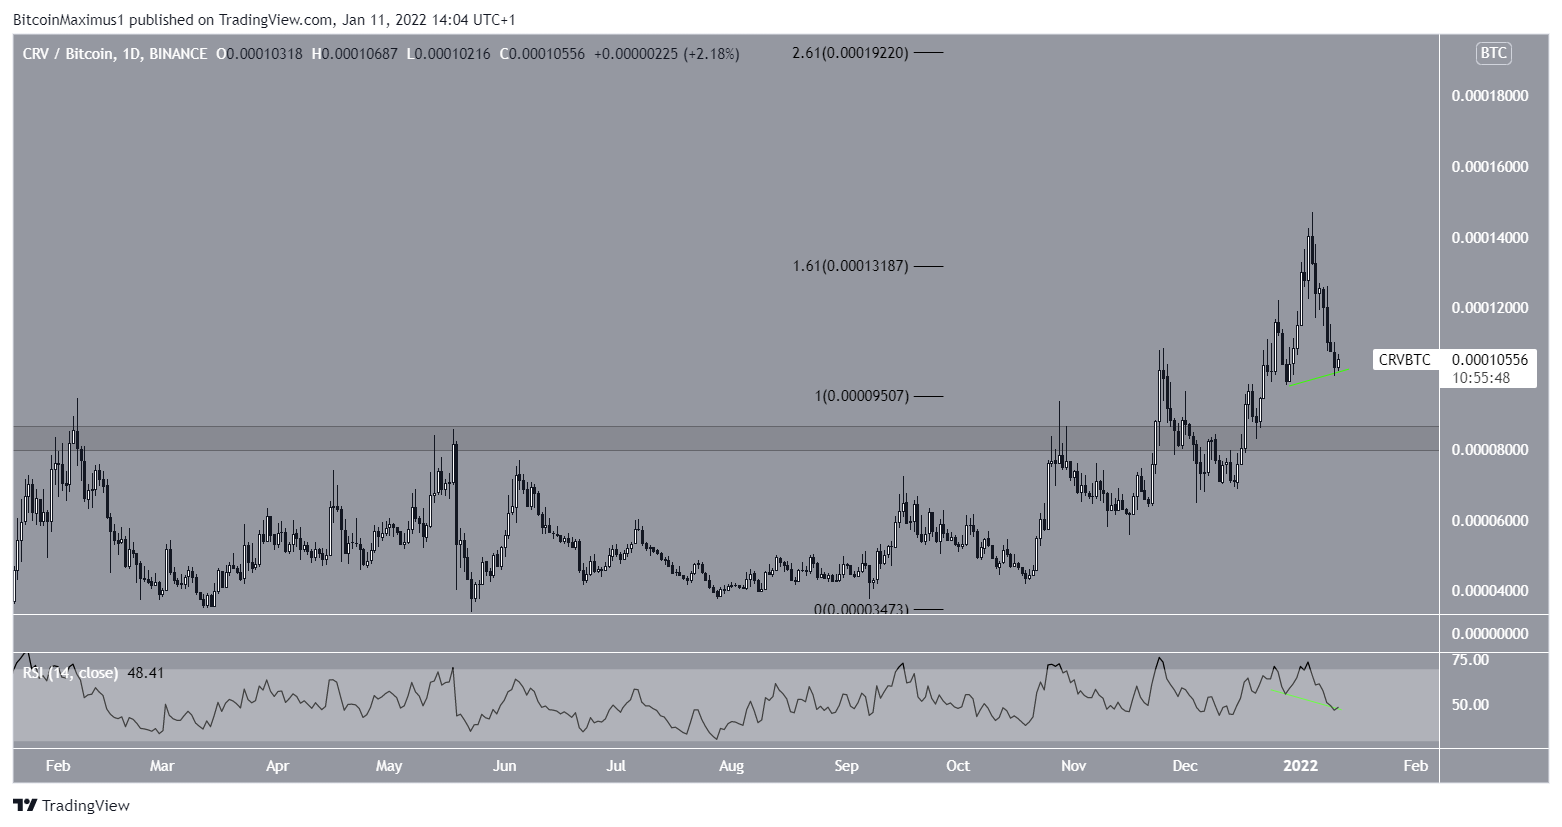
Cryptocurrency trader @CredibleCrypto tweeted a chart of CRV/BTC, stating that the token is bullish as long as it is trading above the 8400 satoshi support area
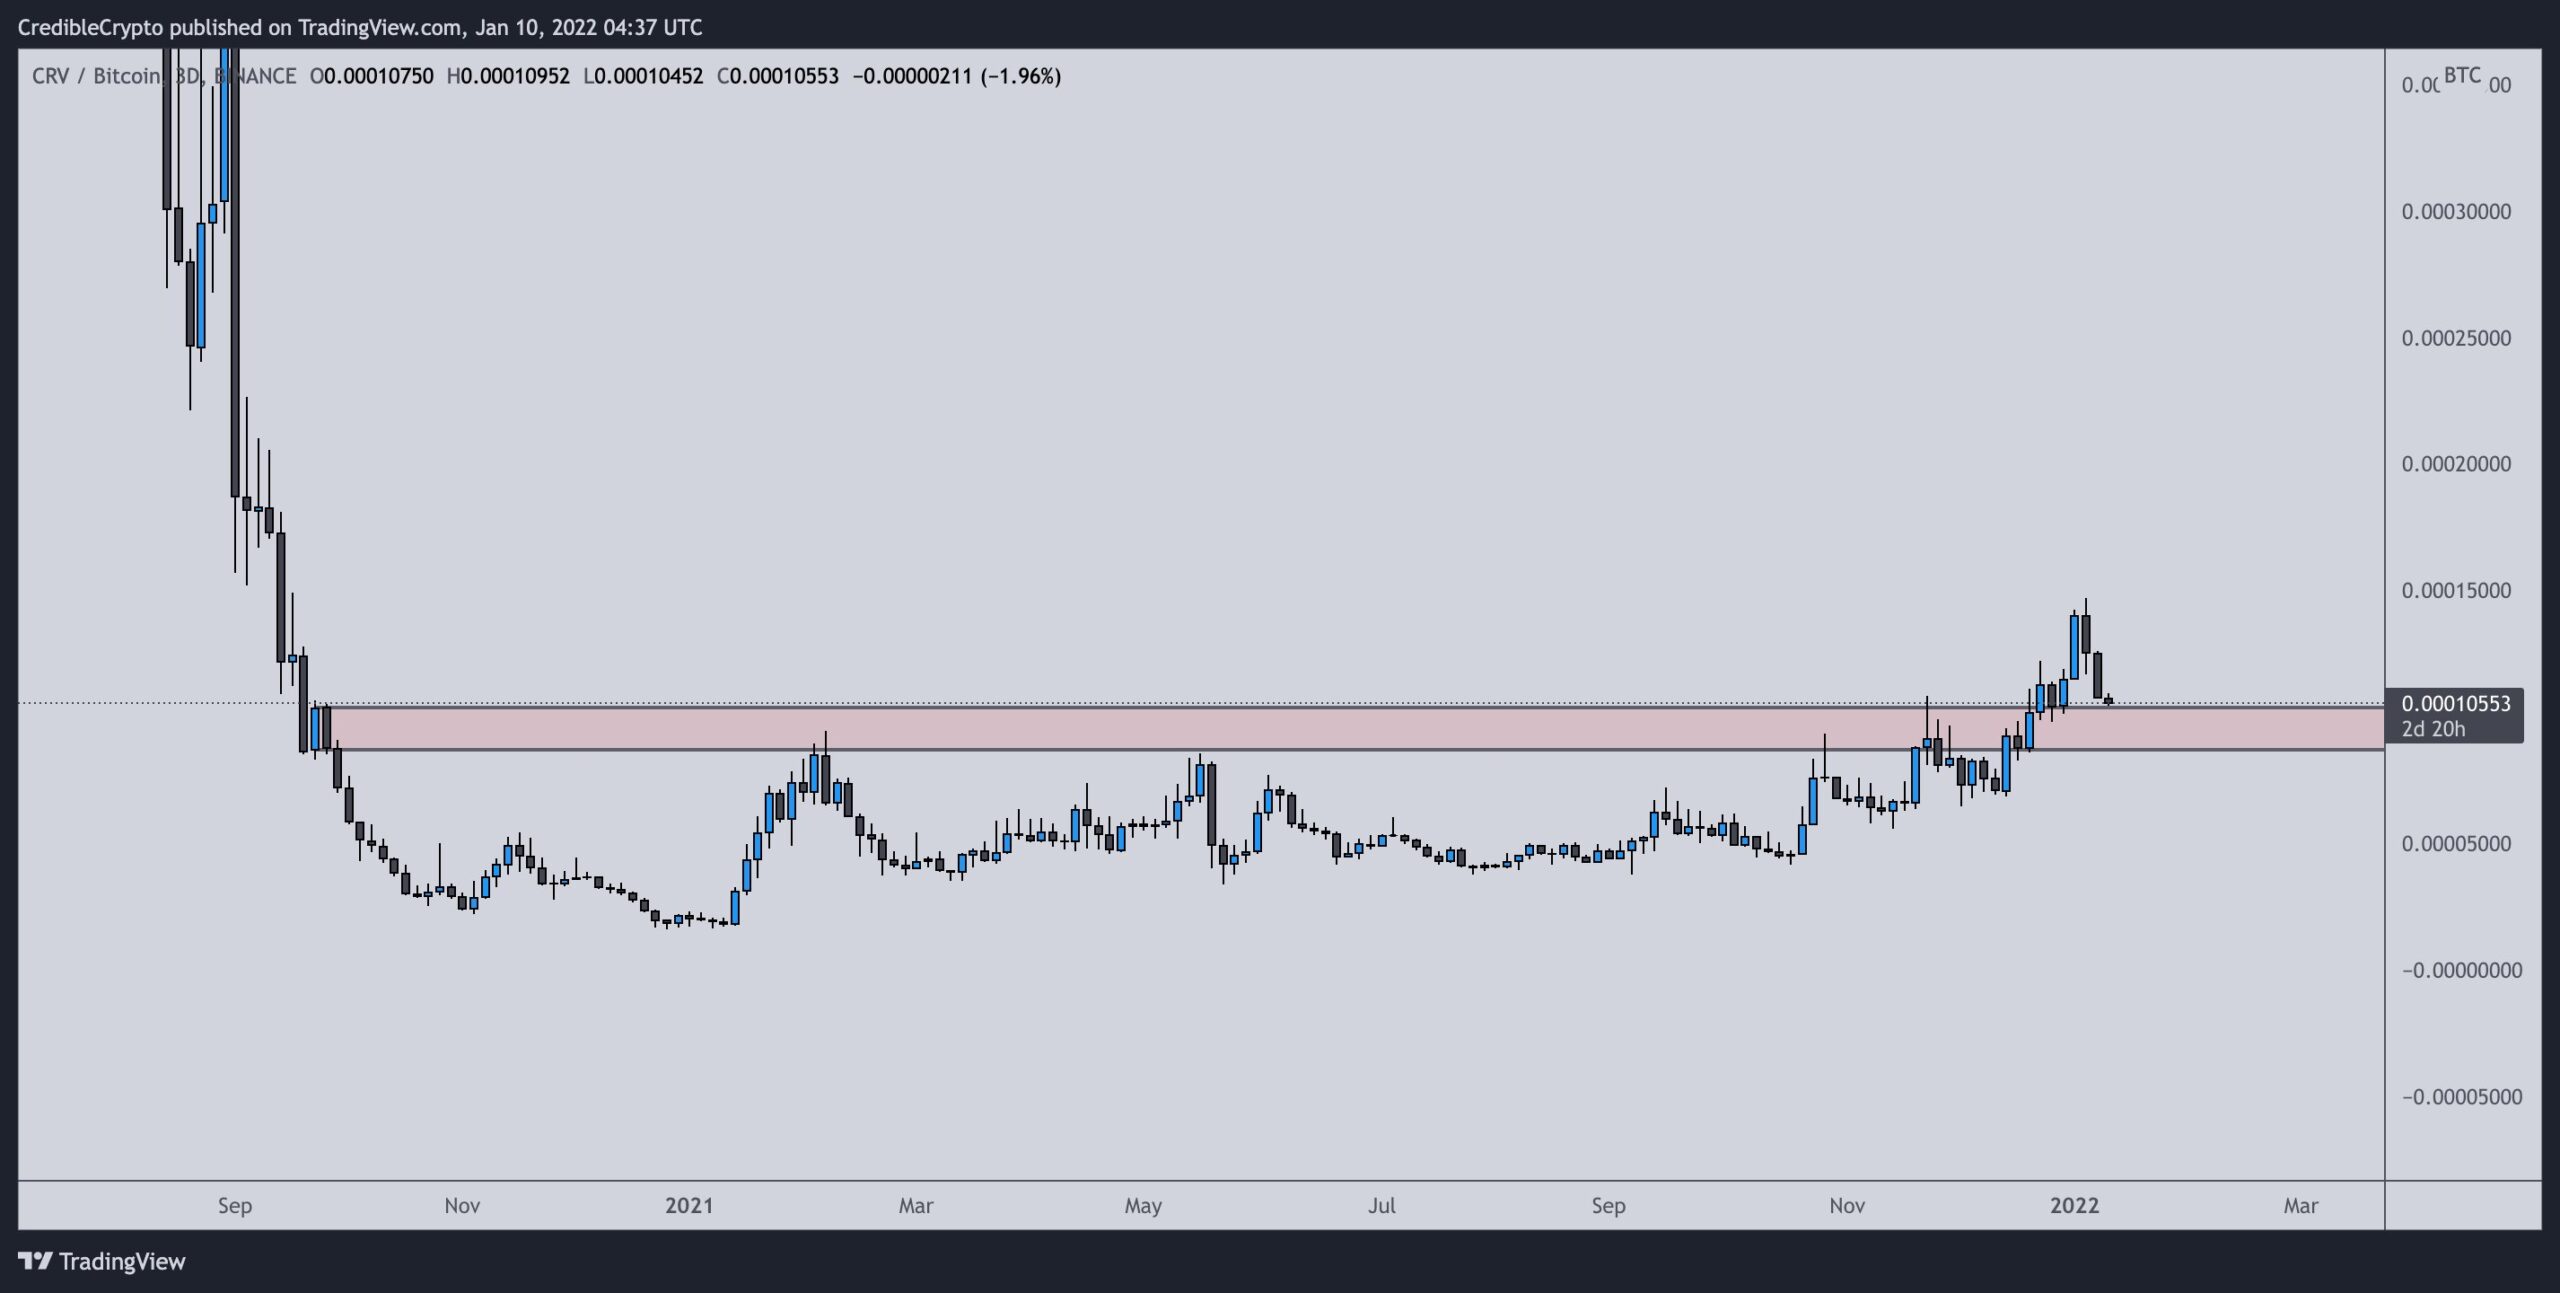

The CRV/BTC chart also looks bullish. The token broke out from the 8400 satoshi resistance area in the end of Dec and proceeded to reach a high of 14,700 satoshis on Jan 4. The high was made just above the 1.61 external Fib retracement resistance level.
There is a significant hidden bullish divergence that has developed in the RSI (green circle), which if stands, could act as the catalyst for the continuation of the upward movement.
The next resistance area would be at 19,220 satoshis, created by the 2.61 external Fib retracement resistance level.
For BeInCrypto’s latest Bitcoin (BTC) analysis, click here.
Disclaimer
All the information contained on our website is published in good faith and for general information purposes only. Any action the reader takes upon the information found on our website is strictly at their own risk.