The Harmony [ONE] coin price chart shows an impressive recovery from its previous correction. The coin price is currently resonating in a rising parallel channel, which is leading this new rally. Though this pattern usually promotes a fallout from the support trendline, until the bottom line is intact the crypto traders can maintain a bullish sentiment.
Key technical points:
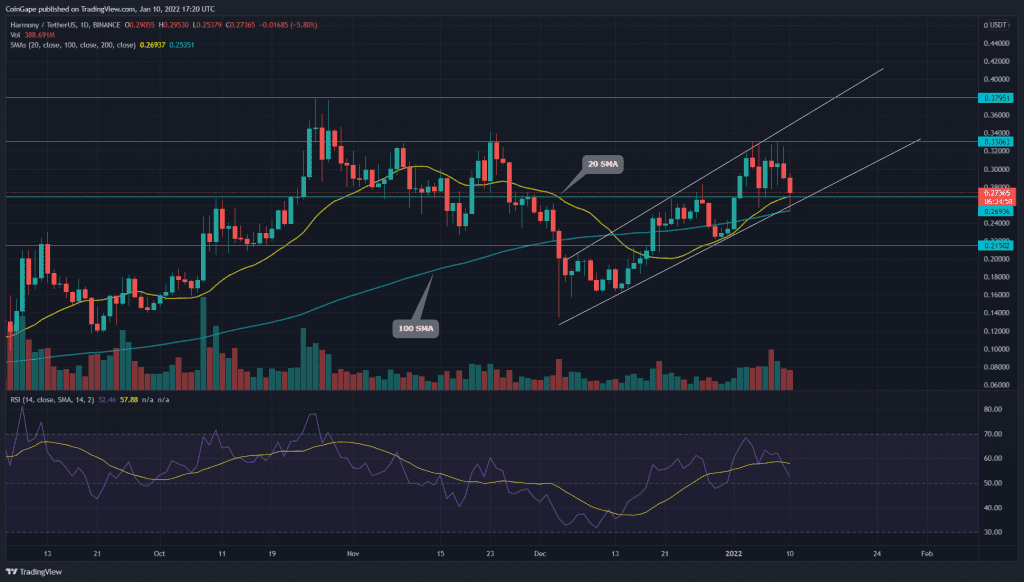
- The ONE coin price obtains strong support from the 20-day EMA
- The daily RSI line slips below the 20-SMA line
- The intraday trading volume in the ONE coin is $375 million, indicating a 21% fall.
 Source- Tradingview
Recently when we covered an article on the Harmony [ONE] coin, its recovery rally was preparing to knock out another higher resistance of $0.33. However, the intense supply pressure from this level rejected the coin price with an evening star pattern.
Even though the price managed to sustain above the $0.27 support, surpassing the $0.33 resistance was still a hectic challenge for the buyers. Furthermore, the technical chart shows the price action is traveling in a rising parallel pattern.
This new rally in ONE coin has crossed above the crucial EMA levels(20, 50, 100), reclaiming the bullish alignment in the daily chart. Moreover, the 20 EMA line provides dynamic support to the coin price.
advertisement
Amid intense selling pressure in the crypto market, the Relative Strength Index(52) is still sustaining above the neutral line(50).
ONE Price Displays Double Top Pattern In The 4-hour Time Frame Chart

Source- Tradingview
In contrast to the above price action, this 4-hour time frame chart shares a bearish outlook for ONE coin price. The coin chart displays a double top pattern with the neckline support at $2.7. Following this pattern, the coin can even violate the rising trendline and initiate another correction rally in the price.
The Moving average convergence divergence shows the MACD and signal are standing on the doorstep of the neural zone(0.00). If the price continues to follow a red path, the indicator lines would drop below the middle line, indicating bearish momentum.
The important resistance levels for ONE price
- Resistance: $0.33, $0.379
- support : $0.27, $215