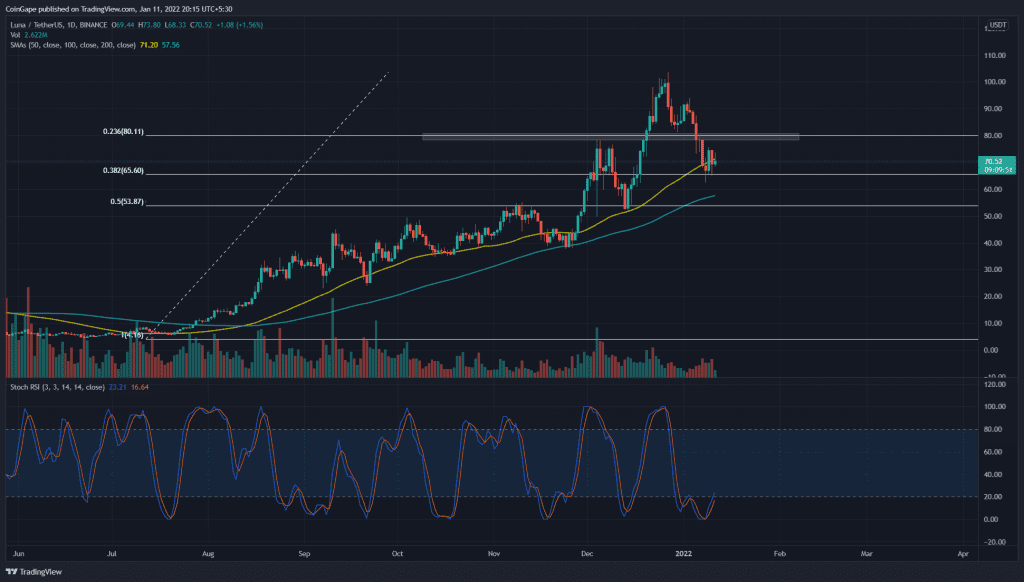
The Terra (LUNA) coin chart shows an overall uptrend. However, the price is currently in a correction phase which has dropped 31% from the $103.3 All-Time High. As for now, the price is hovering above the 0.382 FIB level($65.3), trying to obtain sufficient demand.
Key technical points:
- The LUNA price shows a morning star pattern at the $66 support
- The Stochastic RSI shows a bullish crossover of the K and D line
- The intraday trading volume in the LUNA coin is $2.5 Billion, indicating a 0.1% hike.
 Source- Tradingview
The last time when we covered an article on Terra coin, this pair was rallying for the three-digit milestone inside a rising wedge pattern. However, as warned, the price gave a bearish breakdown from this pattern and triggered a strong sell-off in this coin.
Moreover, the recent bloodbath in the crypto market boasted the selling pressure in LUNA Coin and dropped the LUNA price below the $80 support. Thus, the coin price lost around 28% in less than two weeks and plummeted to the 0.382 Fibonacci retracement support($66.1).
For the bullish trend in the LUNA price, the 50 and 100 SMA lines were majorly covering up for the occasional pullbacks. Even though the recent correction has almost knocked out the 50 SMA line, the 100 and 200 SMA still maintain a bullish sentiment.
advertisement
The Daily-Stochastic RSI has fallen to oversold territory. Furthermore, the K and D lines provide bullish crossovers, suggesting the increasing underlying bullishness in this coin.
LUNA Coin In the 4-hour Time Frame Chart

Source- Tradingview
The LUNA price is currently trading between two important chart levels, i.e., $80 and $66. The crypto traders can consider the area between this level as a No-trading zone. A breakout from either level of this range could determine if the price will recover or extend the correction phase.
The average directional movement index(32) indicated a minor pullback in its bearish momentum due to the price action consolidation near the $66 support. If the price continues to drop lower, the ADX line could show another spike in its chart.
- Resistance levels- $80, and $94
- Support levels-$66 and $53.6