While the market lurched into a possible recovery window, the perception was not quite yet in favor of bulls. The broader market saw a decent recovery over the past three days and thus, reignited the bullish sentiment.
Avalanche marked a double-bottom on its 4-hour chart. With a bullish RSI, the buyers had to step in at the $96-level to confirm a further recovery. Litecoin and MANA jumped above their 20/50 SMA but failed to gather trend-altering volumes.
Avalanche (AVAX)
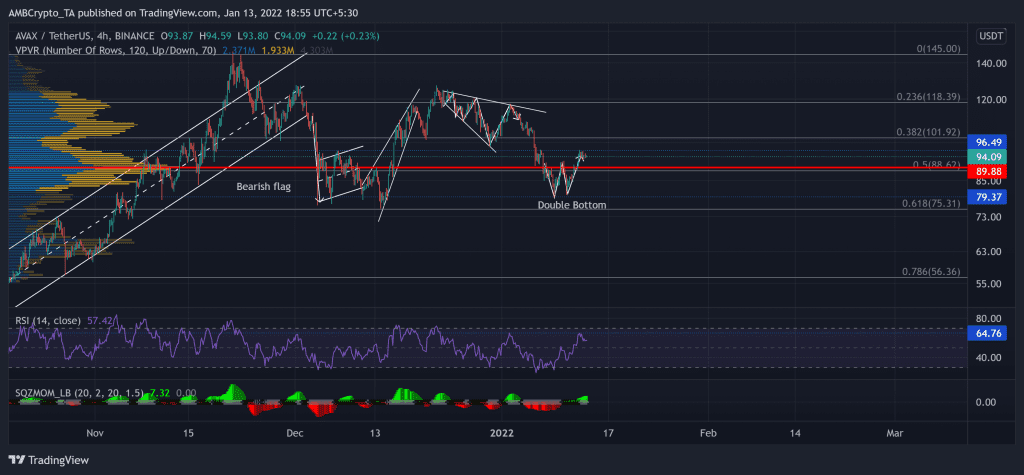
AVAX halted its previous downfall at the 61.8% Fibonacci support. As it reversed, it registered a monstrous 67.8% ROI (from 13 December low) to poke its three-week high on 22 December. Since then, the alt saw a 37.58% retracement and tested the $79.3-support.
Over the past week, after testing the above support, AVAX saw a Double Bottom on its 4-hour chart. Its neckline stood near the Point of control at the $89-mark. Now, the $96-zone was a vital point to overcome for AVAX bulls. Any further retracements would find testing support near the Point of Control.
At press time, the alt traded at $94.09. The RSI marked bullish readings but reversed from the 61-mark. Also, the Squeeze Momentum Indicator suggested a high volatility phase in the near term.
Litecoin (LTC)

Source: TradingView, LTC/USDT
LTC managed to find an oscillating range between the $167 and $143-mark until the 5 January fallout. After exhibiting low volatility, LTC declined by over 19% until it touched its five-month low on 10 January.
The bulls failed to uphold the crucial $143 support level as the bears flipped it to immediate resistance. With this jump, LTC found itself above the 20/50 SMA.
At press time, LTC traded at $138.7. The RSI dipped after testing the overbought mark but still maintained its uptrend. It becomes important to make note of the lower peaks on the Volume Oscillator, hinting at a weak bull move.
Decentraland (MANA)

Source: TradingView, MANA/USDT
On its 4-hour chart, the alt saw a breakdown from the down-channel (yellow) until the $2.7-mark two-month support.
It succumbed to the broader sell-off by over-retracing the previous jump in a down-channel (white). Accordingly, MANA poked its five-week low on 10 January.
Now, with over 17% gains over the past three days, MANA reclaimed the $3.02 support.
At press time, MANA traded above its 20/50 SMA at $3.0587. The RSI tested the 60-mark once again and flashed a bullish bias. Besides, the Volume Oscillator marked lower peaks, hinting at a weak bullish move.