Bitcoin’s chart today generated one of the most bearish signals in traditional technical analysis – the death cross. Does it represent a valid argument for the beginning of a long-term bear market? What has been its historical effectiveness over the nearly 12 years of Bitcoin’s trading? Can the death cross lead to the upside?
Today’s BeInCrypto analysis answers all these questions. We look at all 8 instances of death cross in the history of BTC to understand how much today’s event could affect the cryptocurrency market in the near future. The conclusions may be surprising!
What is a death cross?
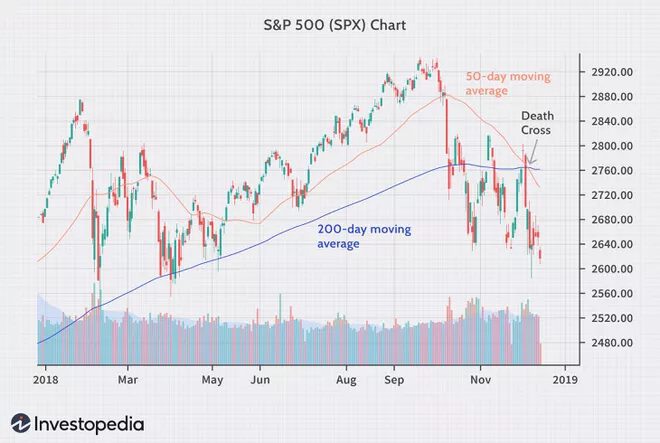
A death cross is a pattern in classic technical analysis where the relative short-term moving average crosses below the relative long-term moving average (MA). Its opposite is the golden cross. The former is a confirmation of a downtrend, while the latter indicates an uptrend.
Traditionally, the death cross and golden cross are assumed to occur between the 50 MA and 200 MA on the daily chart. These curves take into account a large amount of data, so their movement is more an indication of a long-term trend than a reaction to current changes in the price of an asset.

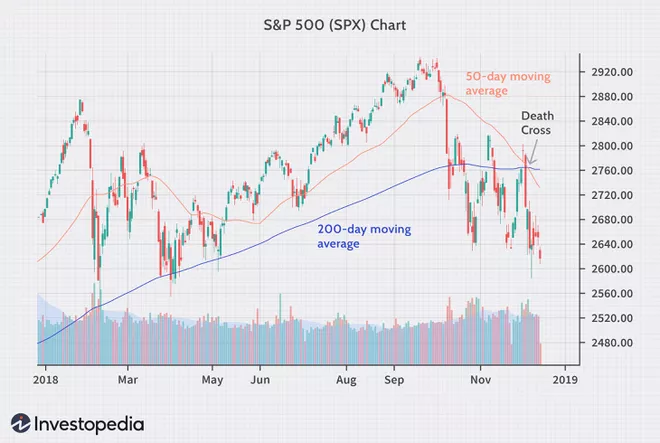
Death cross, like most technical indicators, is a so-called lagging indicator. This means that it only confirms events that have already taken place in the market and possibly indicates a general trend. For this reason, its readings often generate false signals and should never be used without reference to other indicators.
Death cross for Bitcoin
Bitcoin is currently struggling to hold long-term support in the $40,000-$42,500 area. It reached this range after a roughly 40% decline from the all-time high at $69,000 on November 10, 2021.
The sharp decline in the price of BTC over the past 2 months has led to a decline in the 50 MA, which today intersects the 200 MA. Thus, a classic death cross on Bitcoin (red circle) is taking place today. Interestingly, the 200 MA still has a positive slope as its reaction to the recent price decline is delayed.
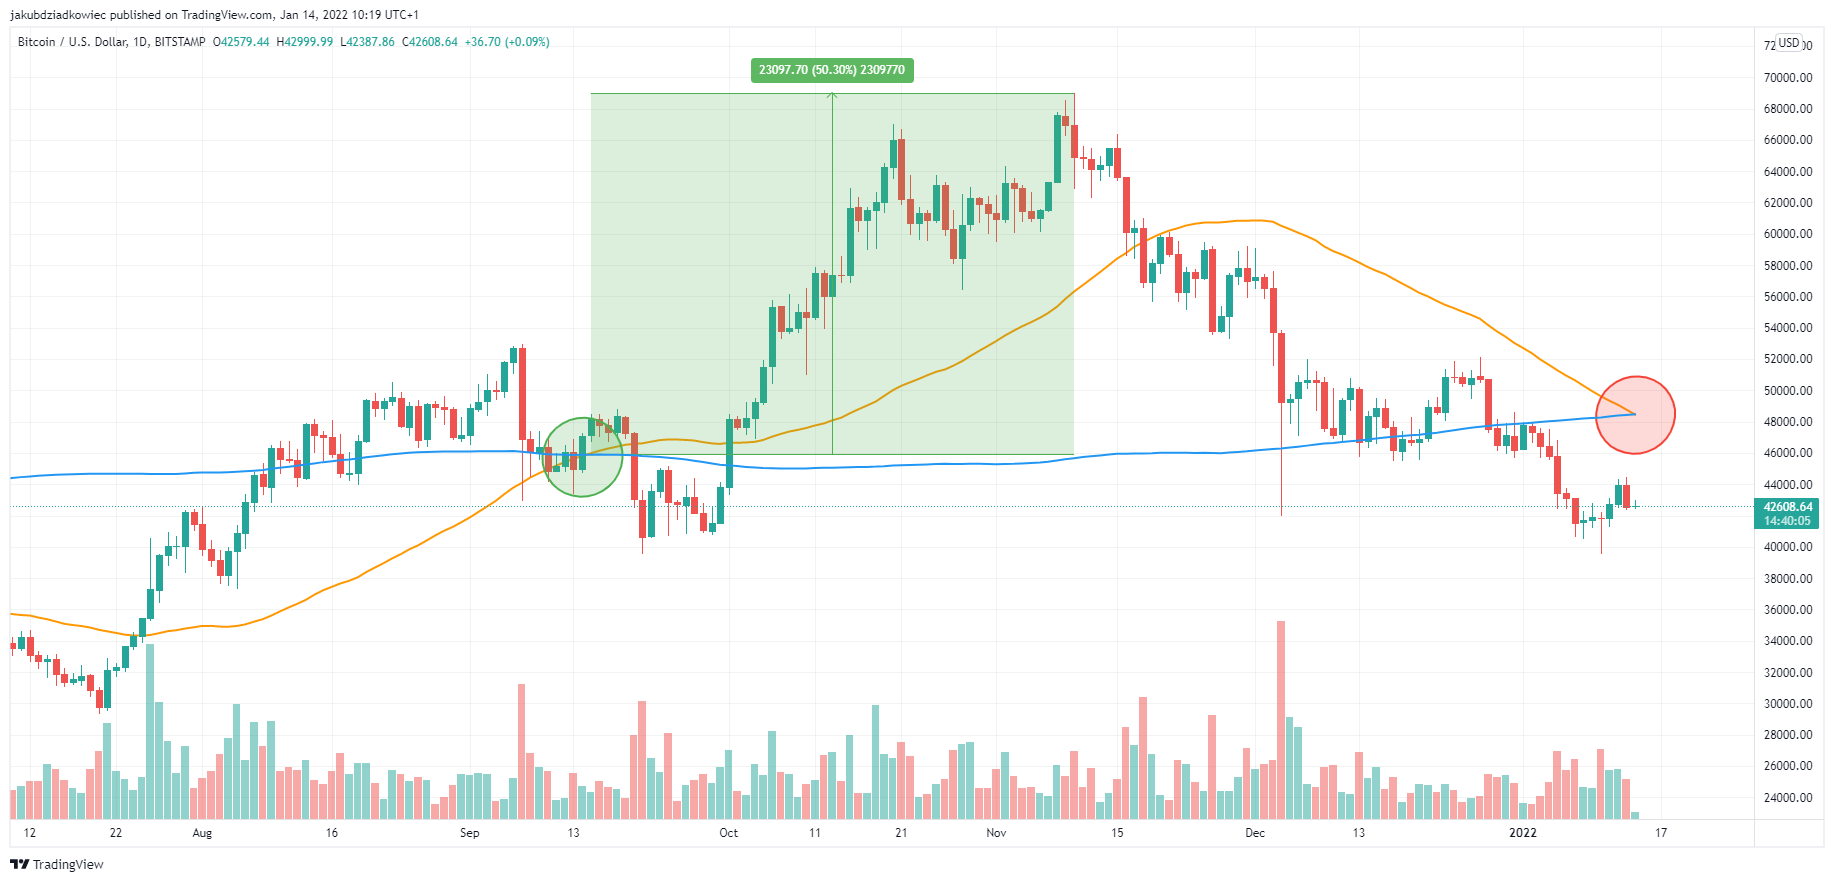

On 15 September 2021, we witnessed a golden cross on the BTC chart (green circle). Its appearance was a consequence of the dynamic growth of Bitcoin prices after reaching the bottom at $29,500 on July 21, 2021. Measuring from this event to the ATH, the largest cryptocurrency gained 50%. This was despite initially falling 14% and recording a bottom at $39,500.
Historical performance: 2011-2018
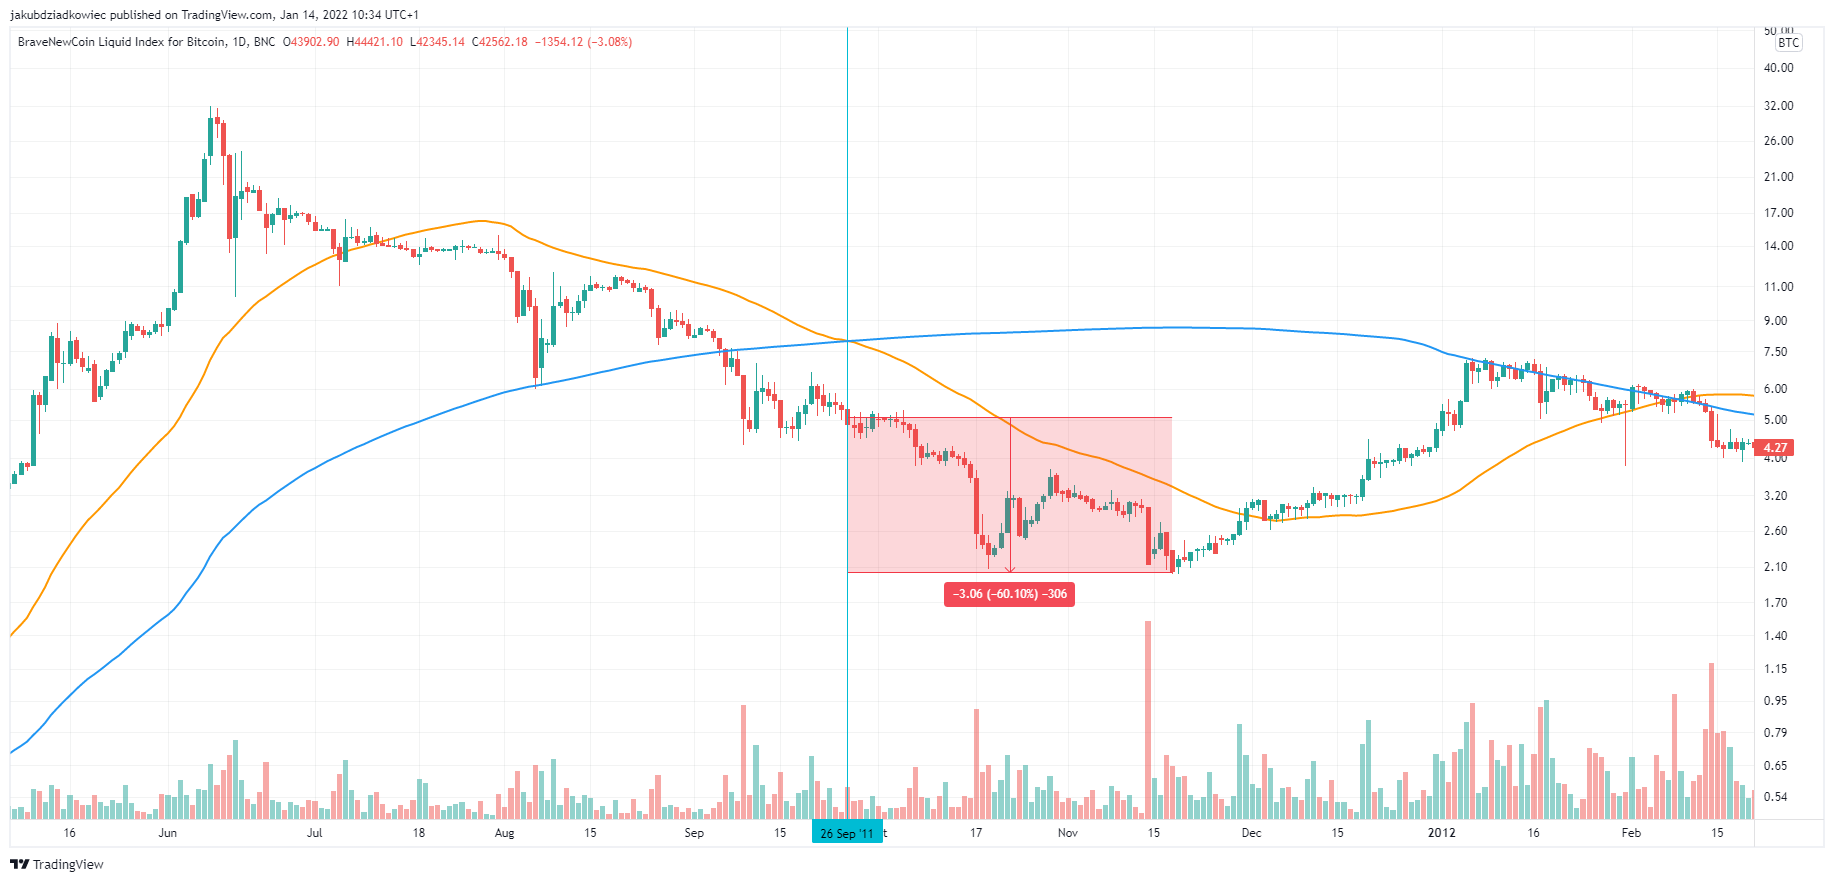
In Bitcoin’s almost 12-year trading history, death cross has happened 8 times. Let’s take a look at the price action that followed this signal each time to see if we should expect the start of a bear market. For a better illustration of price and trend changes, we use a logarithmic chart.
The first death cross happened during Bitcoin’s genesis cycle on September 28, 2011. At that time, BTC was falling after peaking at $31.90. Since crossing the 50 MA below the 200 MA, Bitcoin has lost another 60%. It recorded a macro bottom at $2.01 on November 18, 2011. It never returned to that price again thereafter.
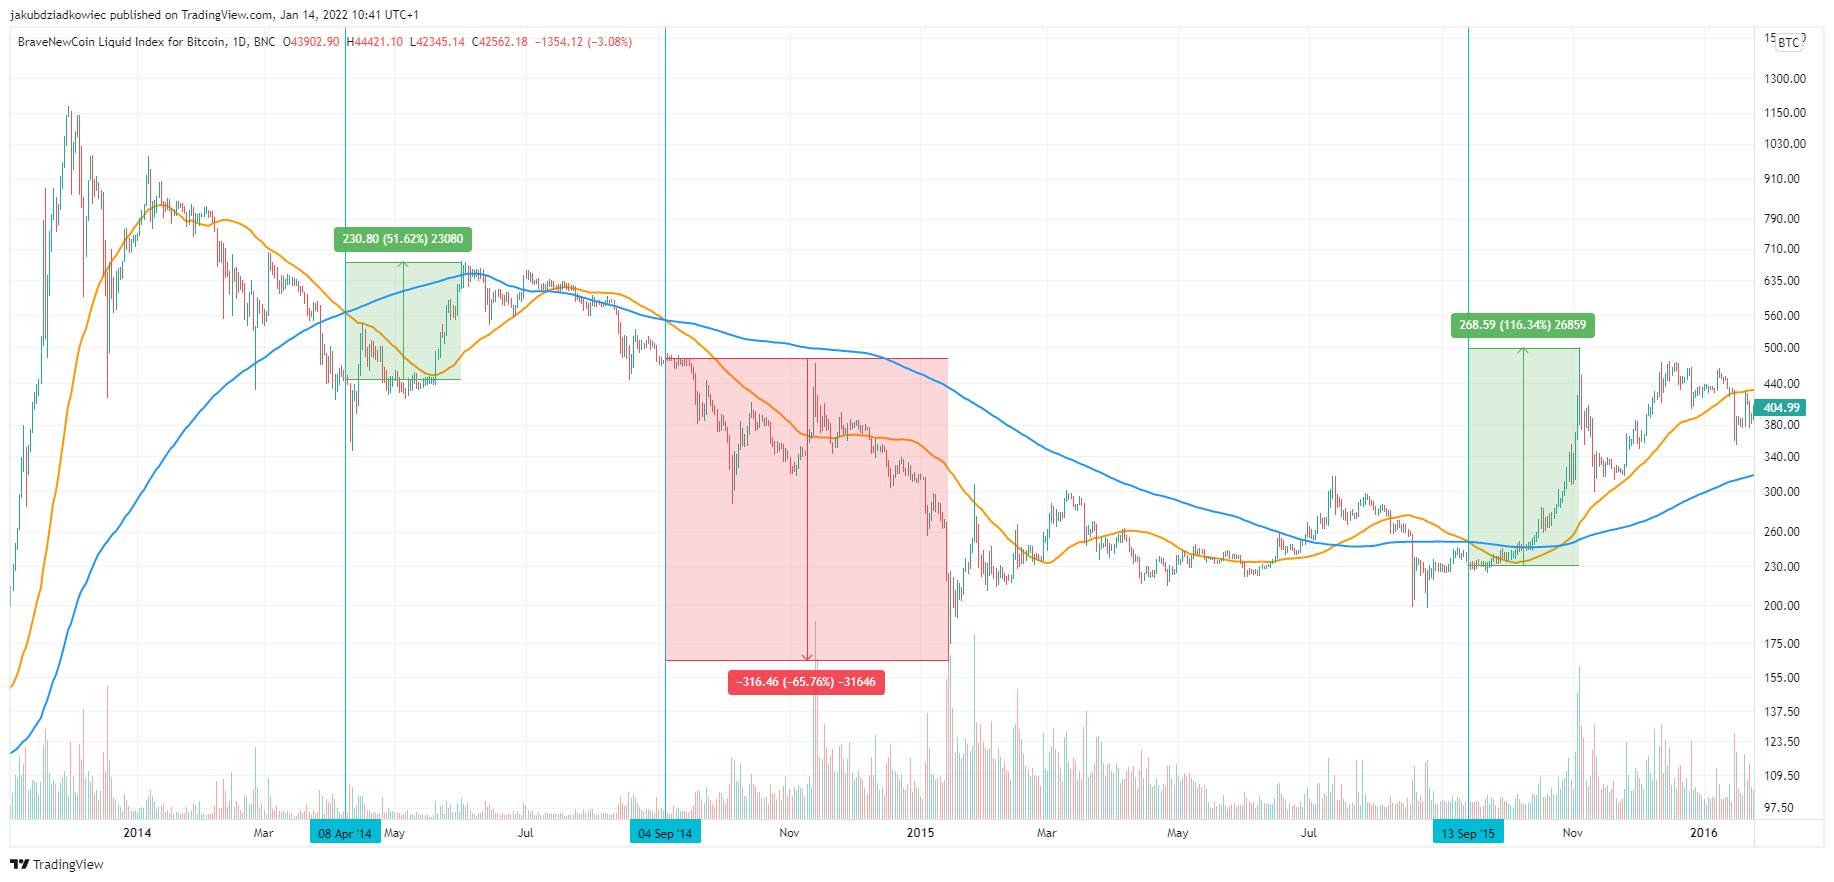
Another 3 instances of death cross took place after the bull market of 2012-2013. The bearish signals occurred after Bitcoin established a peak at $1177 on November 30, 2013. Interestingly, with only one of these signals leading to sharp declines and reaching a bear market bottom. Further, instances of death cross have occurred:
- on April 8, 2014, after which BTC rose by 52%,
- on September 4, 2014, after which BTC fell by 66%,
- on September 13, 2015, after which BTC rose by 116%.
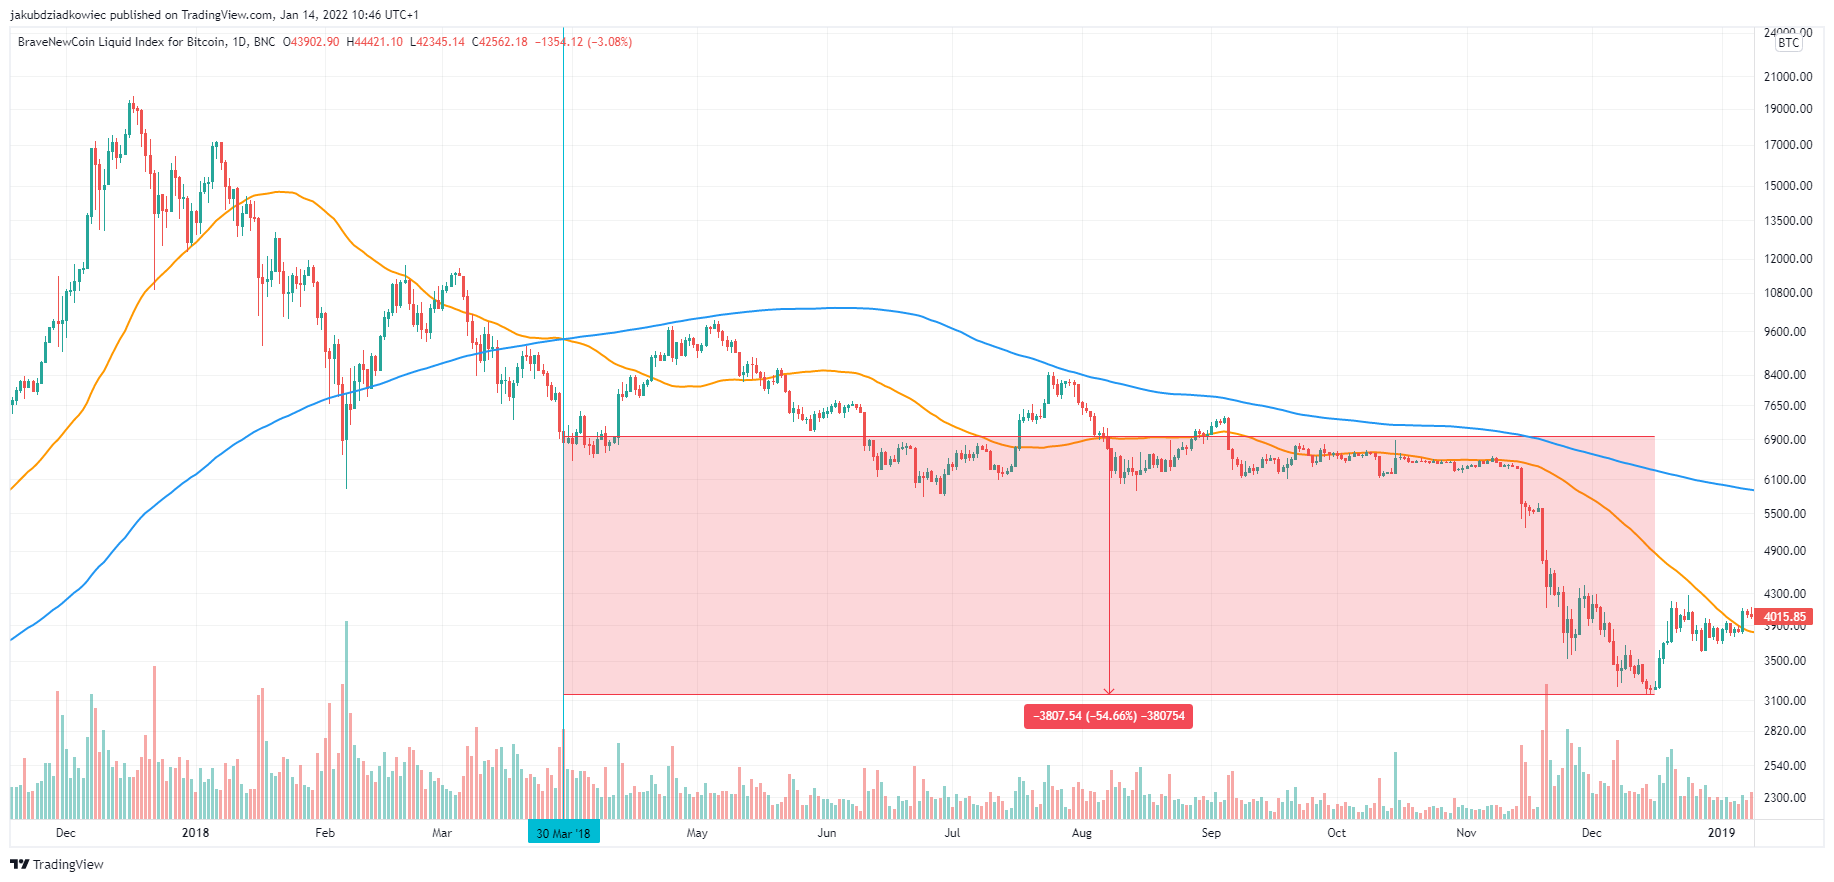
After another bull market of 2016-2017 and a historical ATH at $19,764 death cross happened on March 30, 2018. Immediately after this signal, Bitcoin rose by 42%. However, it eventually declined for the next 9 months, reaching a bottom at $3,148 on December 15, 2018. Measured from the intersection of the 50 MA below the 200 MA, this was a 55% decline.
Historical performance: 2019-2021
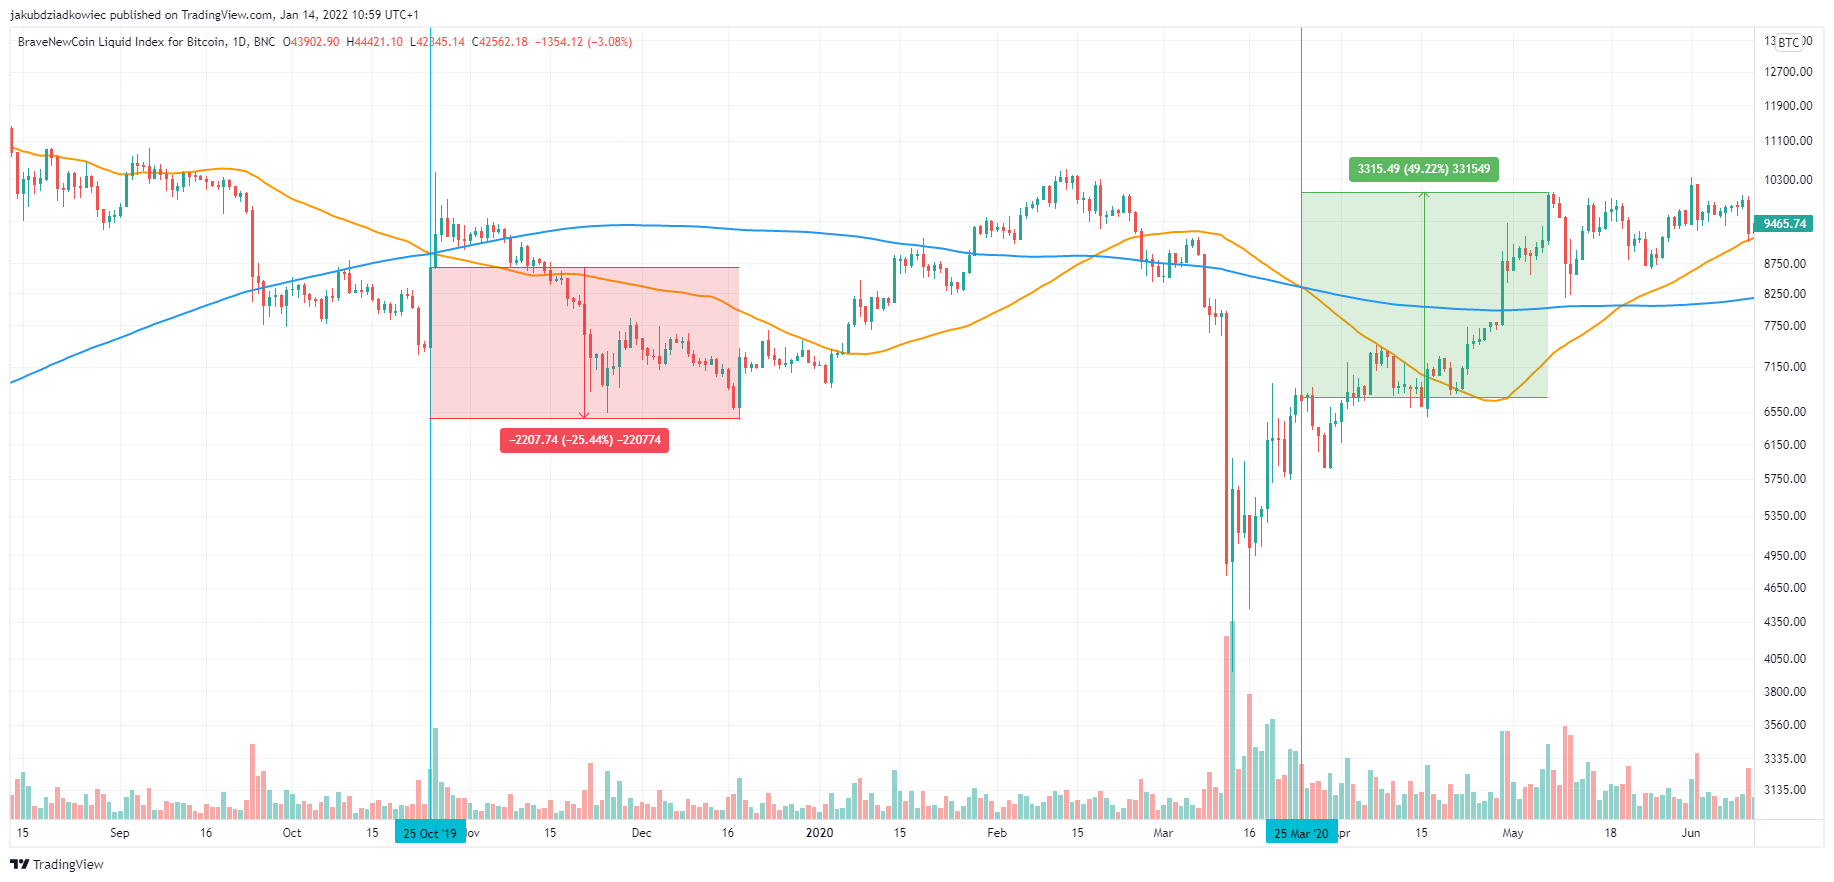
The next 2 death cross cases were in late 2019 and early 2020. Both signals were mixed, and the price action that followed was not easily predictable. A black swan related to the COVID-19 pandemic happened in March 2020, which made possible predictions even more difficult. Death cross took place:
- on October 25, 2019, after which BTC fell by 25%,
- on March 25, 2020, after which, BTC rose by 49%.
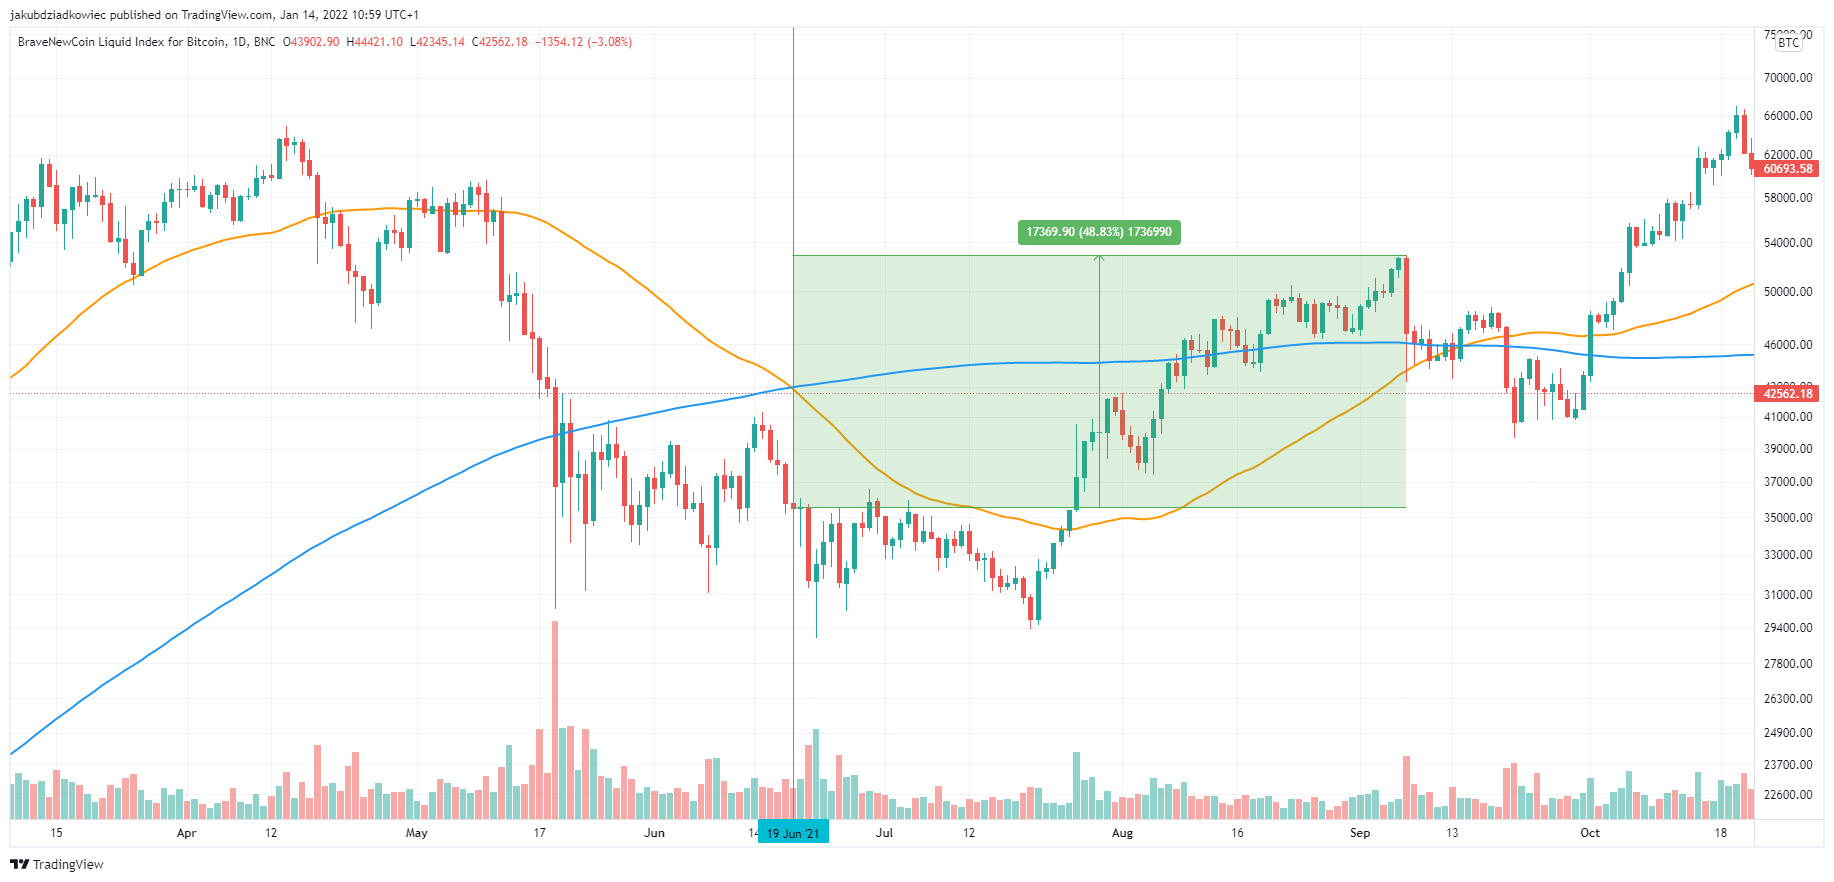
Finally, the most recent death cross – prior to the one taking place today – happened on June 19, 2021. At that time, Bitcoin was experiencing a deepened, 55% correction from its historical ATH of $64,840 on April 14, 2021.
The death cross then occurred a month before the correction ended. Immediately afterwards, the BTC price admittedly fell another 18%, but eventually rebounded and rose 49% before the next golden cross, which we wrote about in the previous section.
Conclusion
The historical analysis of Bitcoin prices after the occurrence of death cross gives mixed results. In 50% of cases, the indicator correctly signaled a downtrend and predicted further declines – by 51.5% on average. On the other hand, in the remaining 50% of cases, it generated a false signal and further increases occurred – by 66.5% on average.
These results lead to several conclusions:
- Death cross on the Bitcoin chart is not an unambiguous signal of the continuation of the downtrend and has a significantly lower effectiveness than in traditional markets.
- The thesis of the beginning of a bear market cannot be defended with reference to this indicator alone. It should be juxtaposed with other signals.
- In the long term, the BTC market grows over time, so even bearish death cross readings historically lead to slightly larger gains than losses.
For BeInCrypto’s latest Bitcoin (BTC) analysis, click here.
Disclaimer
All the information contained on our website is published in good faith and for general information purposes only. Any action the reader takes upon the information found on our website is strictly at their own risk.