Crypto-verse is gaining huge popularity day by day. Investors around the globe are realizing the massive growth potential this market brings, adding cryptocurrencies in their portfolios. However, while diversifying a portfolio, penny coins or stocks are the ones that provide the most gains to investors if selected carefully.
In this article, we will provide you with some of the top penny crypto coins which are yet to take off and you may purchase to grab massive ROI in 2022. This is based on our analysis and in no way is an investment advise.
- Stellar (XLM) Price Trapped In A Narrow Range
 Source-Tradingview
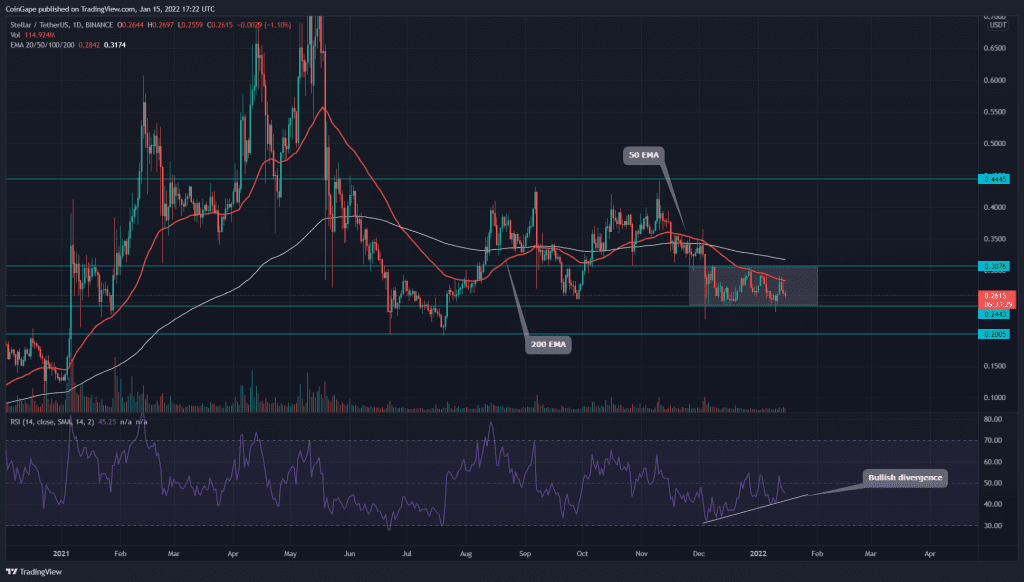
The Stellar coin price shows an overall sideways trend. Around mid-November 2021, the price initiated a retracement rally, which plunged the price to the $0.245 mark. For more than a month, the price has been resonating between the $0.3 and $0.245 mark, creating a short-range.
The crypto traders looking for long opportunities should for the price to breach the overhead resistance, as it can began a proper recovery phase and rally the price to $0.44 or beyond.
The crucial EMAs(50 and 200) have flattened due to the sideways movement in price. However, these EMAs currently indicate a bearish trend. This daily Relative Strength Index (45) slope is charging toward the neutral line for a bullish crossover. Moreover, the bullish divergence in the RSI chart hints at a better possibility for price to escape the range with an upside breakout.
- XRP Price Preparing Its Next Move Resonating In A Symmetrical
Source- Tradingview
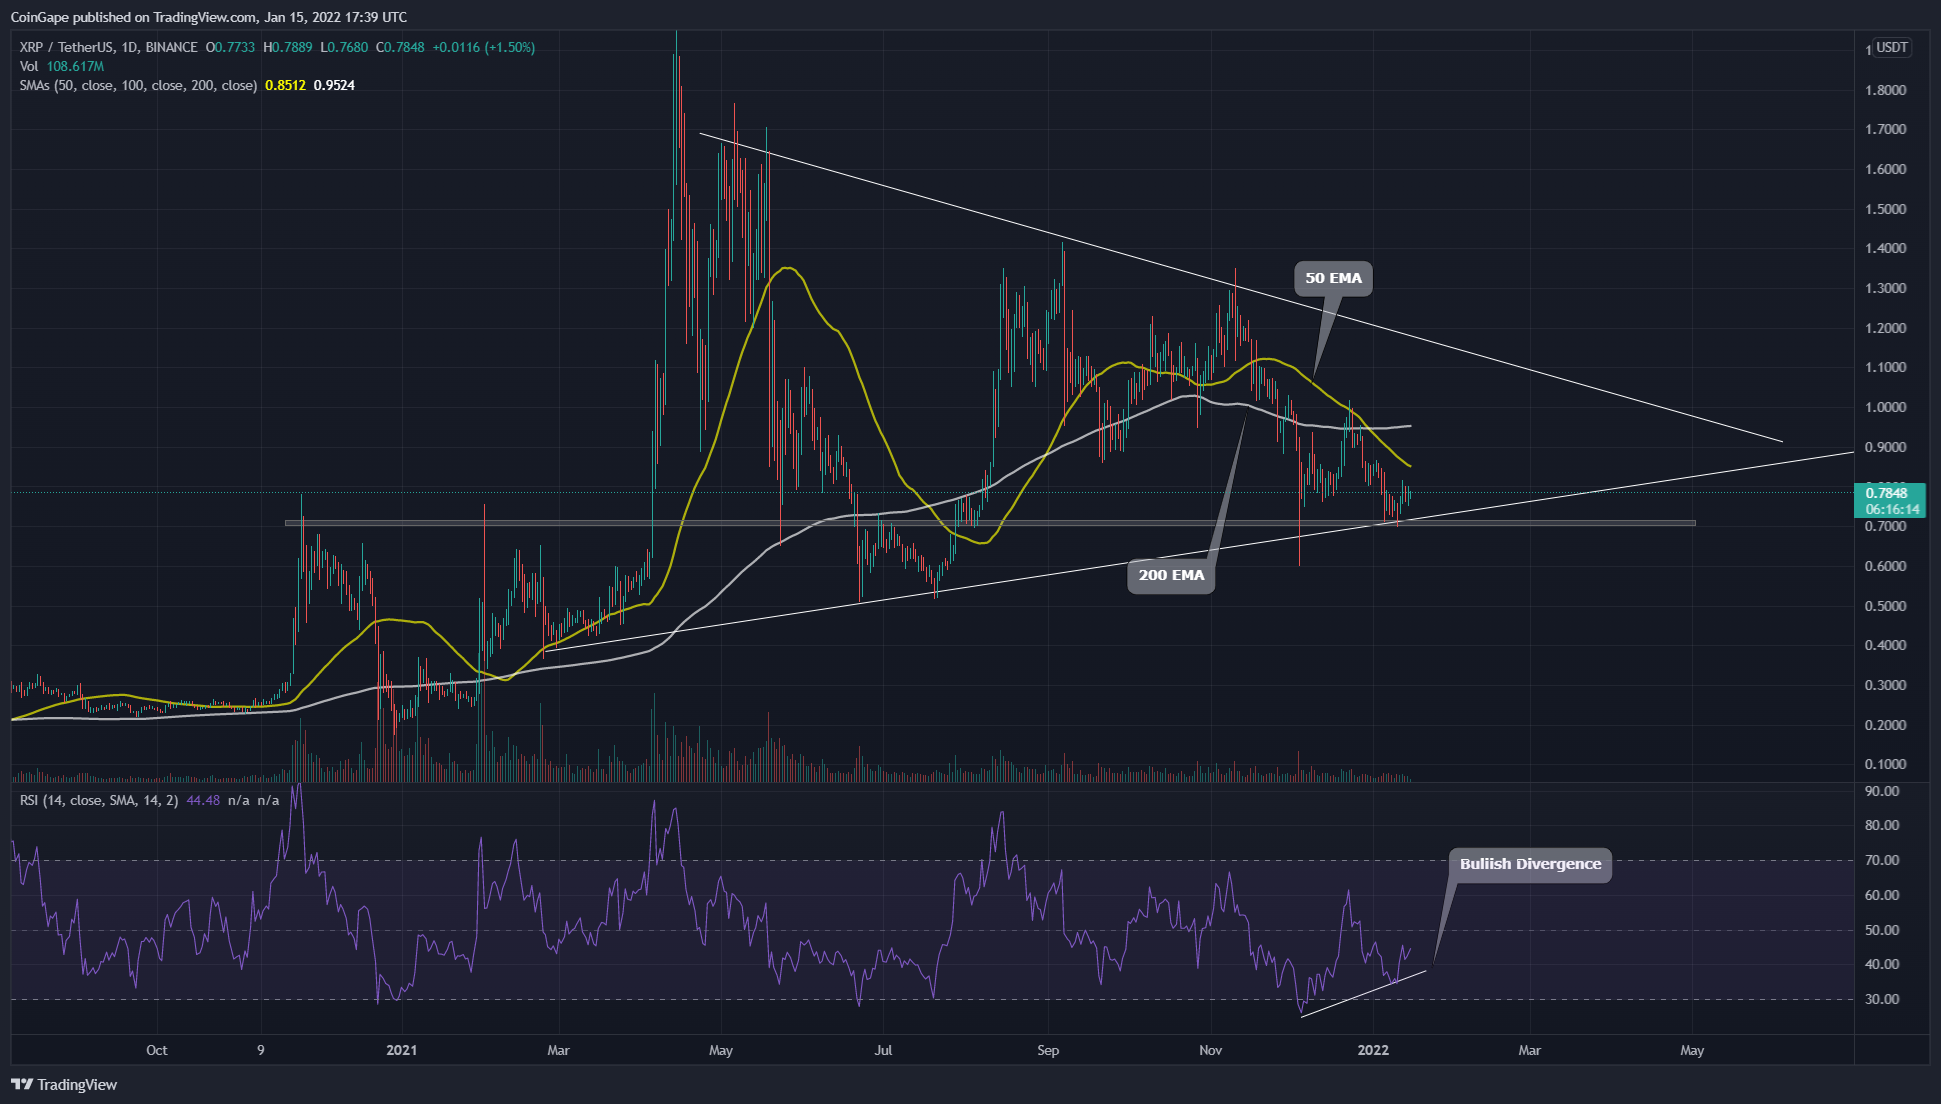
The XRP price chart shows the formation of a symmetrical triangle pattern in the daily time frame chart. The price is currently hovering above a combined support of $0.7 horizontal level and a rising trendline. If the price manages to sustain above this level, the coin could climb to the overhead resistance($1.1).
Furthermore, once the price escapes this triangle pattern, the crypto traders can expect a directional move to trade.
Due to the range-bound movement in price action, the longer EMA levels(100 and 200) have flattened. As for now, the XRP price moving these EMAs indicates a downtrend.
- ROSE Price Steady Sailing North
Source- Tradingview
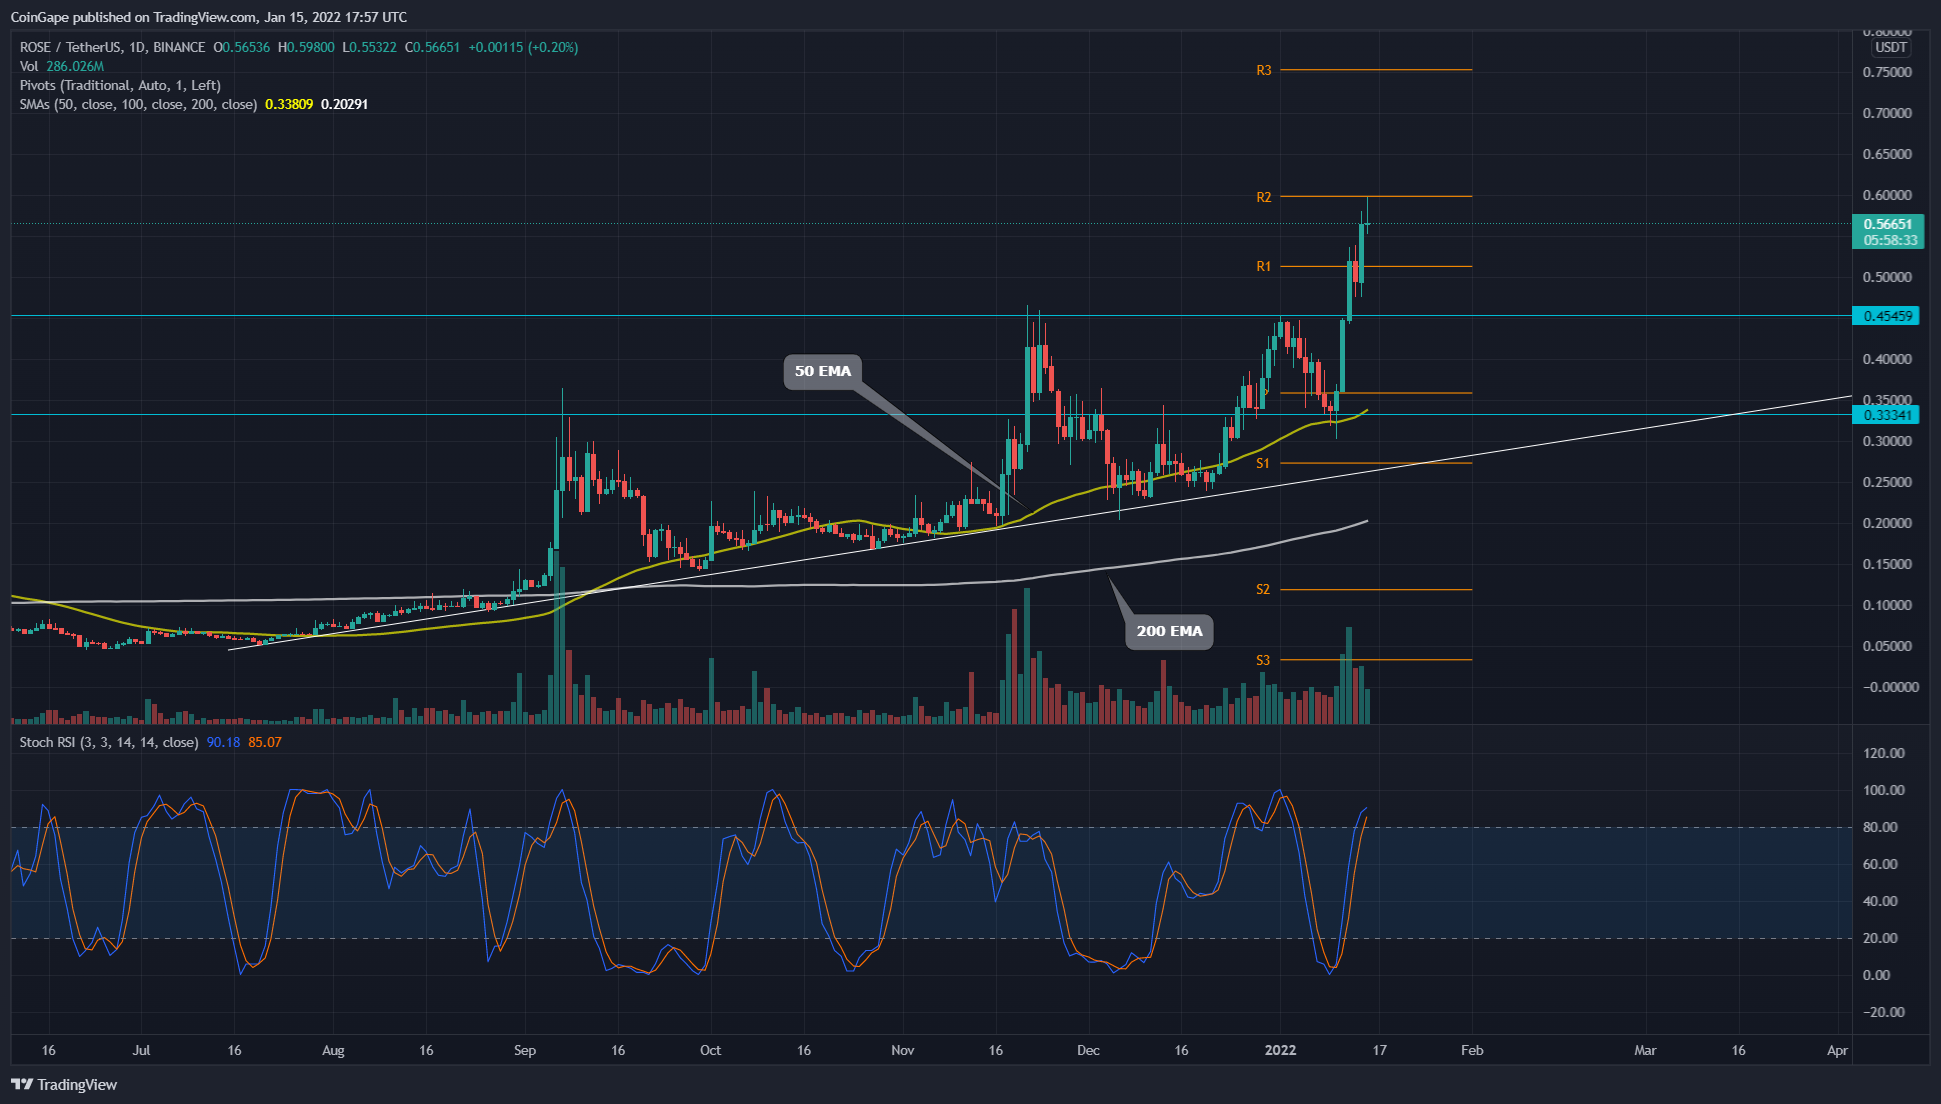
The ROSE price chart shows an overall bullish trend. Since July 2021, an ascending trendline has been leading this bull run. However, the increasing underline bullishness in the coin has left behind this rising trendline and displays a parabolic rally in its chart.
ROSE price has recently breached its previous All-Time High of around $0.45, indicating even more potential for its uptrend. The price might give a pullback to retest this new flipped support($0.45), providing a long entry opportunity.
The ROSE coin price trading is above the crucial SMAs(20, 50, 100, and 200). These EMA lines would provide strong support to the coin price during the occasional correction phase.
As per the traditional pivot level, the crypto traders can expect the overhead supply region at $0.6 and $0.754. And for the opposite sides, the support levels are $0.515 and $0.358.
- Can This Falling Channel Lead Ravencoin To $0.2 mark?

Source- Tradingview
The RVN coin resonates in a falling parallel channel pattern in the daily time frame chart. Even though this pattern travels in a downtrend, it provides an excellent long opportunity trade when the price breaches the overhead resistance trendline.
The price has recently been rejected from the resistance rejection, indicating the price could drop to the bottom support line. The horizontal support levels for this coin are $0.9, followed by $0.78.
The RVN sellers dropped the coin price below the 200 EMA line. The price is currently retesting this new resistance in search of sufficient supply.
- Bullish RSI divergence Could Bolster The Double Bottom Pattern ZIL Price

Source- Tradingview
Around mid-December of 2021, the ZIL coin bounced back from the $0.056 mark. The recovery rally managed to gain 50% in around one week and rose to the $0.085 mark. However, the intense selling pressure at this resistance rejected the coin price and dumped it back to the bottom support($0.056).
The price again gain trying for a bullish reversal could eventually lead to the formation of a double bottom pattern. The neckline for this pattern is at $0.86, whose breakout could offer a bullish opportunity.
However, the crypto trader should watch out for the descending trendline, providing strong resistance to the coin price.
This daily Relative Strength Index (47) slope is on the verge of entering the bullish territory( above 50%). Moreover, the bullish divergence in the RSI chart supports the formation of a double bottom pattern.