Bitcoin is currently testing a crucial support area holding the price for the past several weeks. The next days or even hours will likely determine which direction BTC will head to in the short term.
While a bullish reversal is probable if the level holds, there is the possibility of a bearish breakdown, leading to another long liquidation cascade below the $40K mark.
Technical Analysis
Bitcoin’s price has been in a strong downtrend since the $69K top during the first half of November 2021. However, it is yet to go through a lower low, which indicates that BTC is theoretically still in an uptrend momentum.
The grey highlighted area is the critical support based on the previous price action. It has already been tested once and bottomed nicely with a huge wick, which further confirms this zone’s ability to hold the price from dropping below $40K.
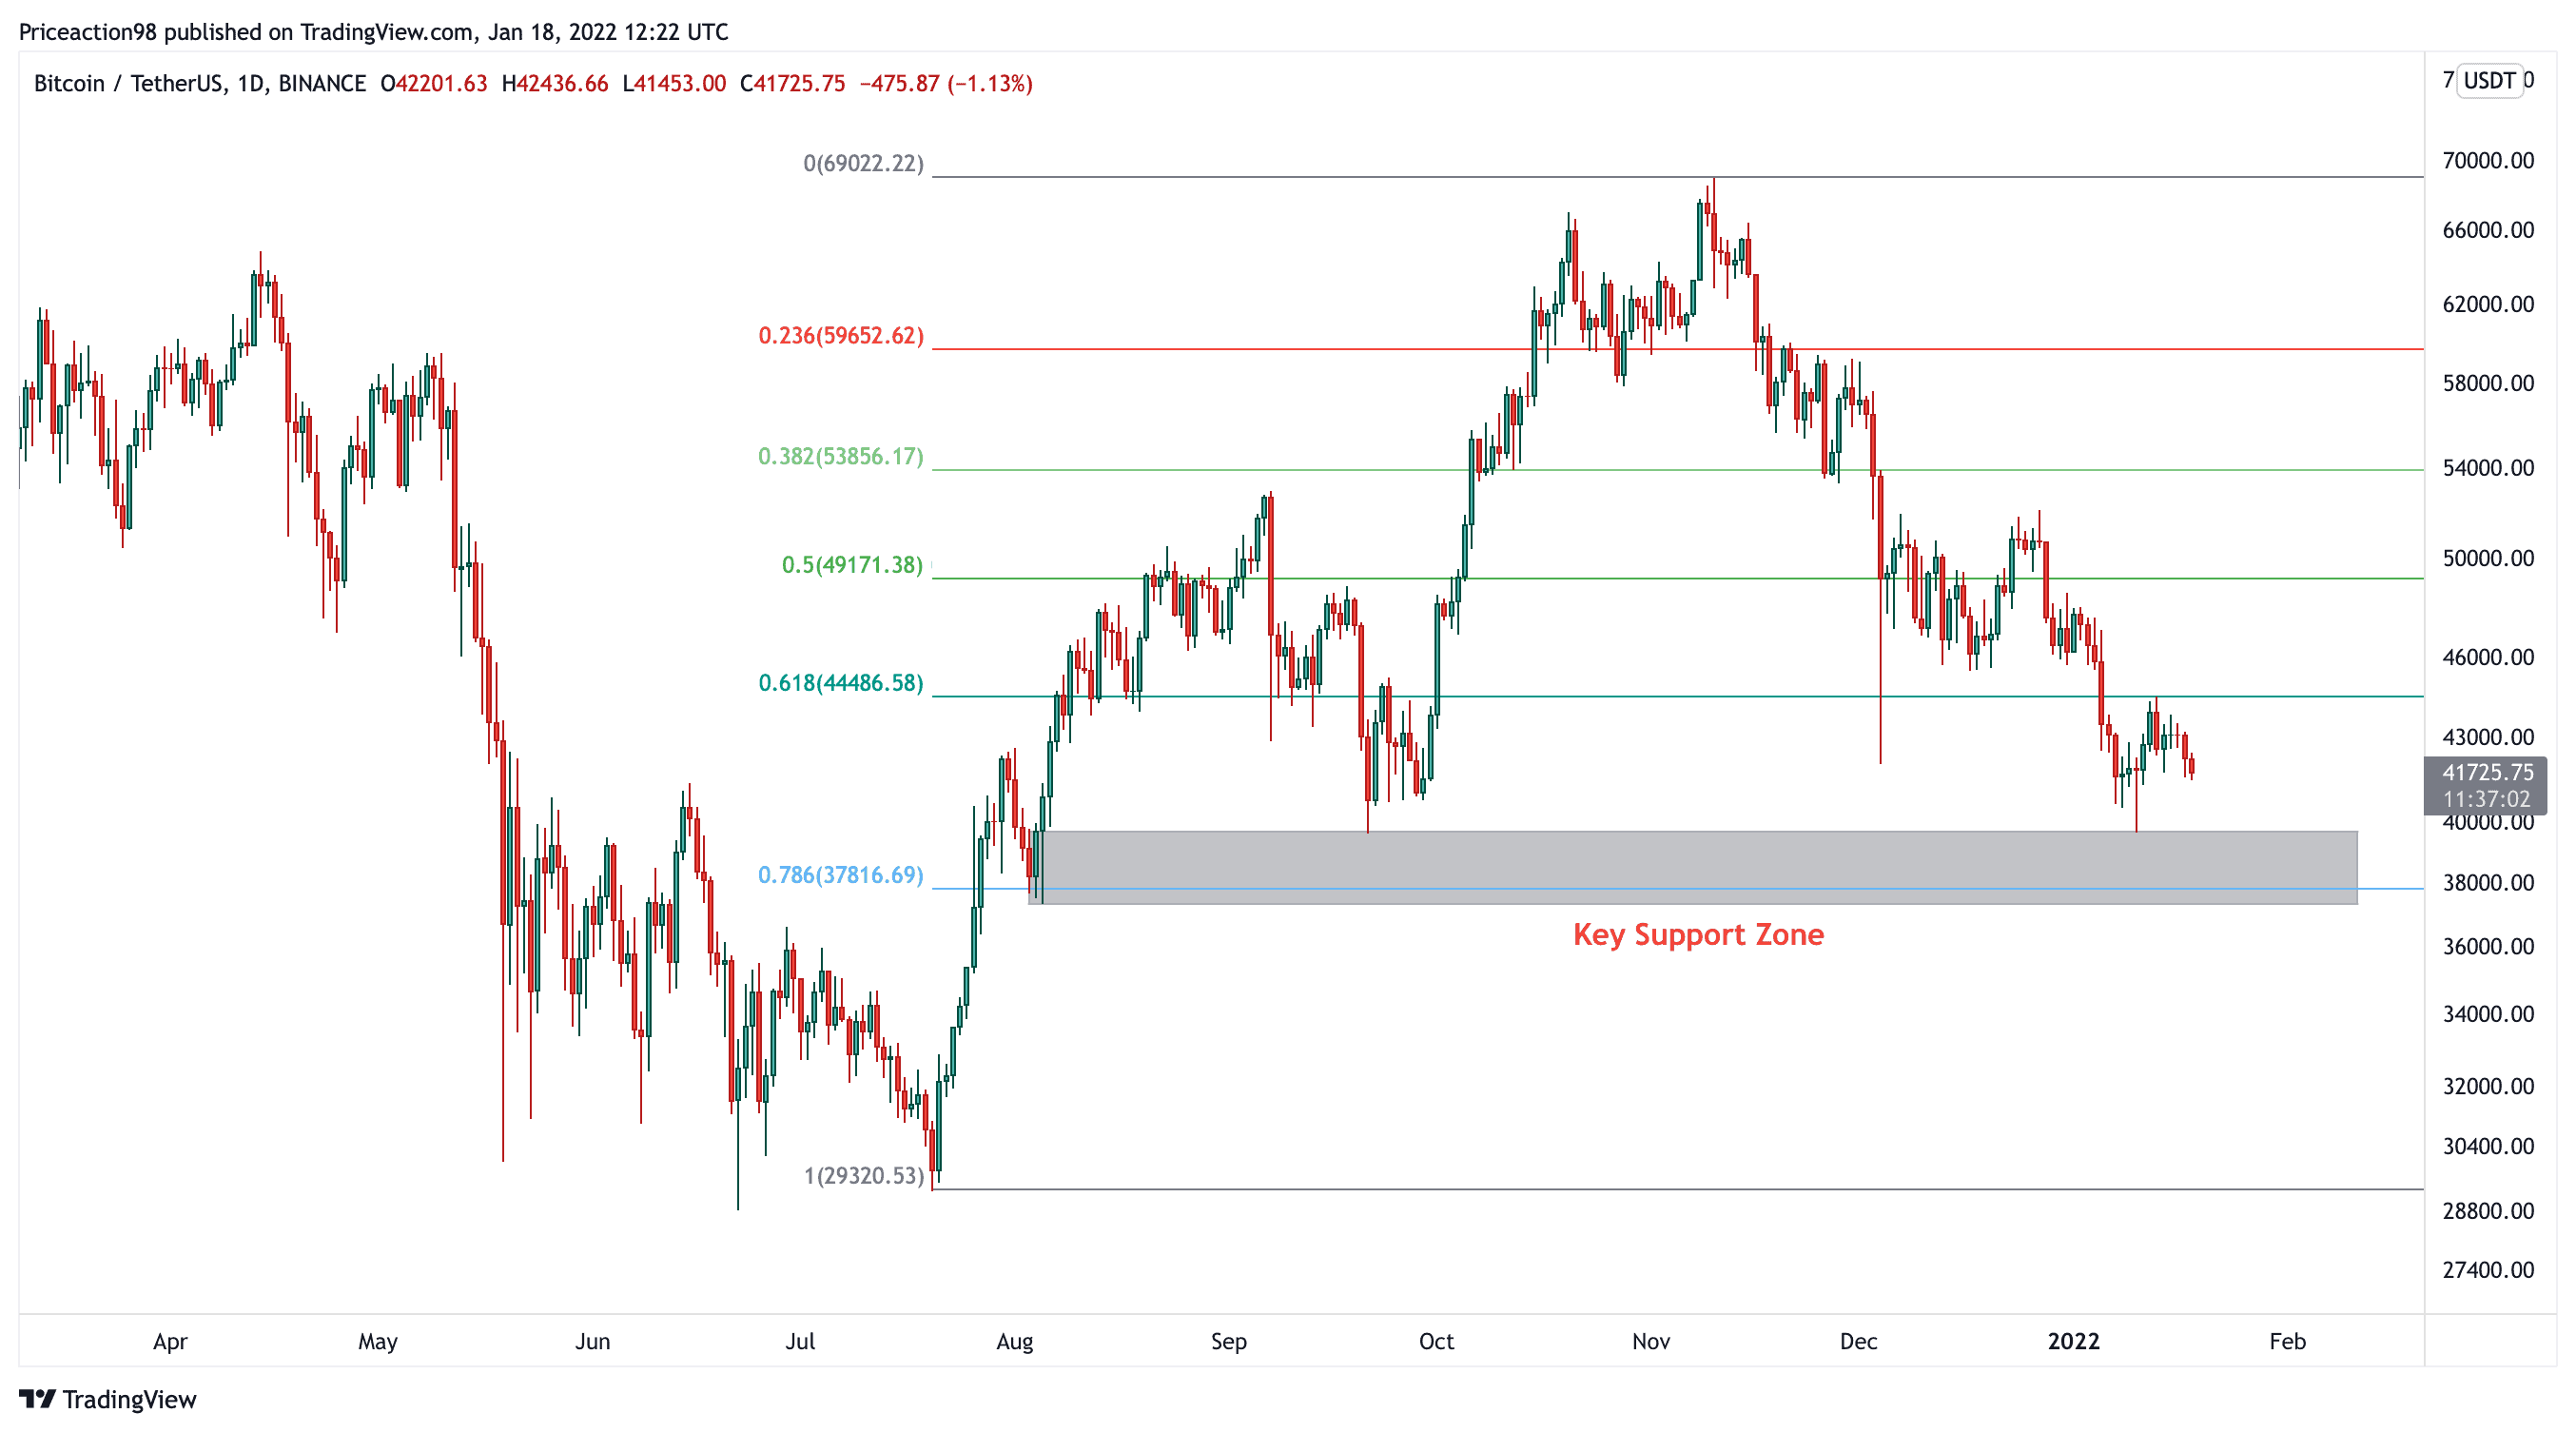
Additionally, this support area has coincided nicely with the last significant Fibonacci retracement level of 0.786. Highly volatile assets like Bitcoin tend to experience deep pullbacks; hence, it’s pretty standard for BTC to test deep Fibonacci levels.
All these signs confirm our bias that the $37-40K area serves as critical support, and if the BTC price breaks below this level, BTC will chart a lower low, and most likely, the short to mid-term bull run will be terminated.
Short-Term Analysis
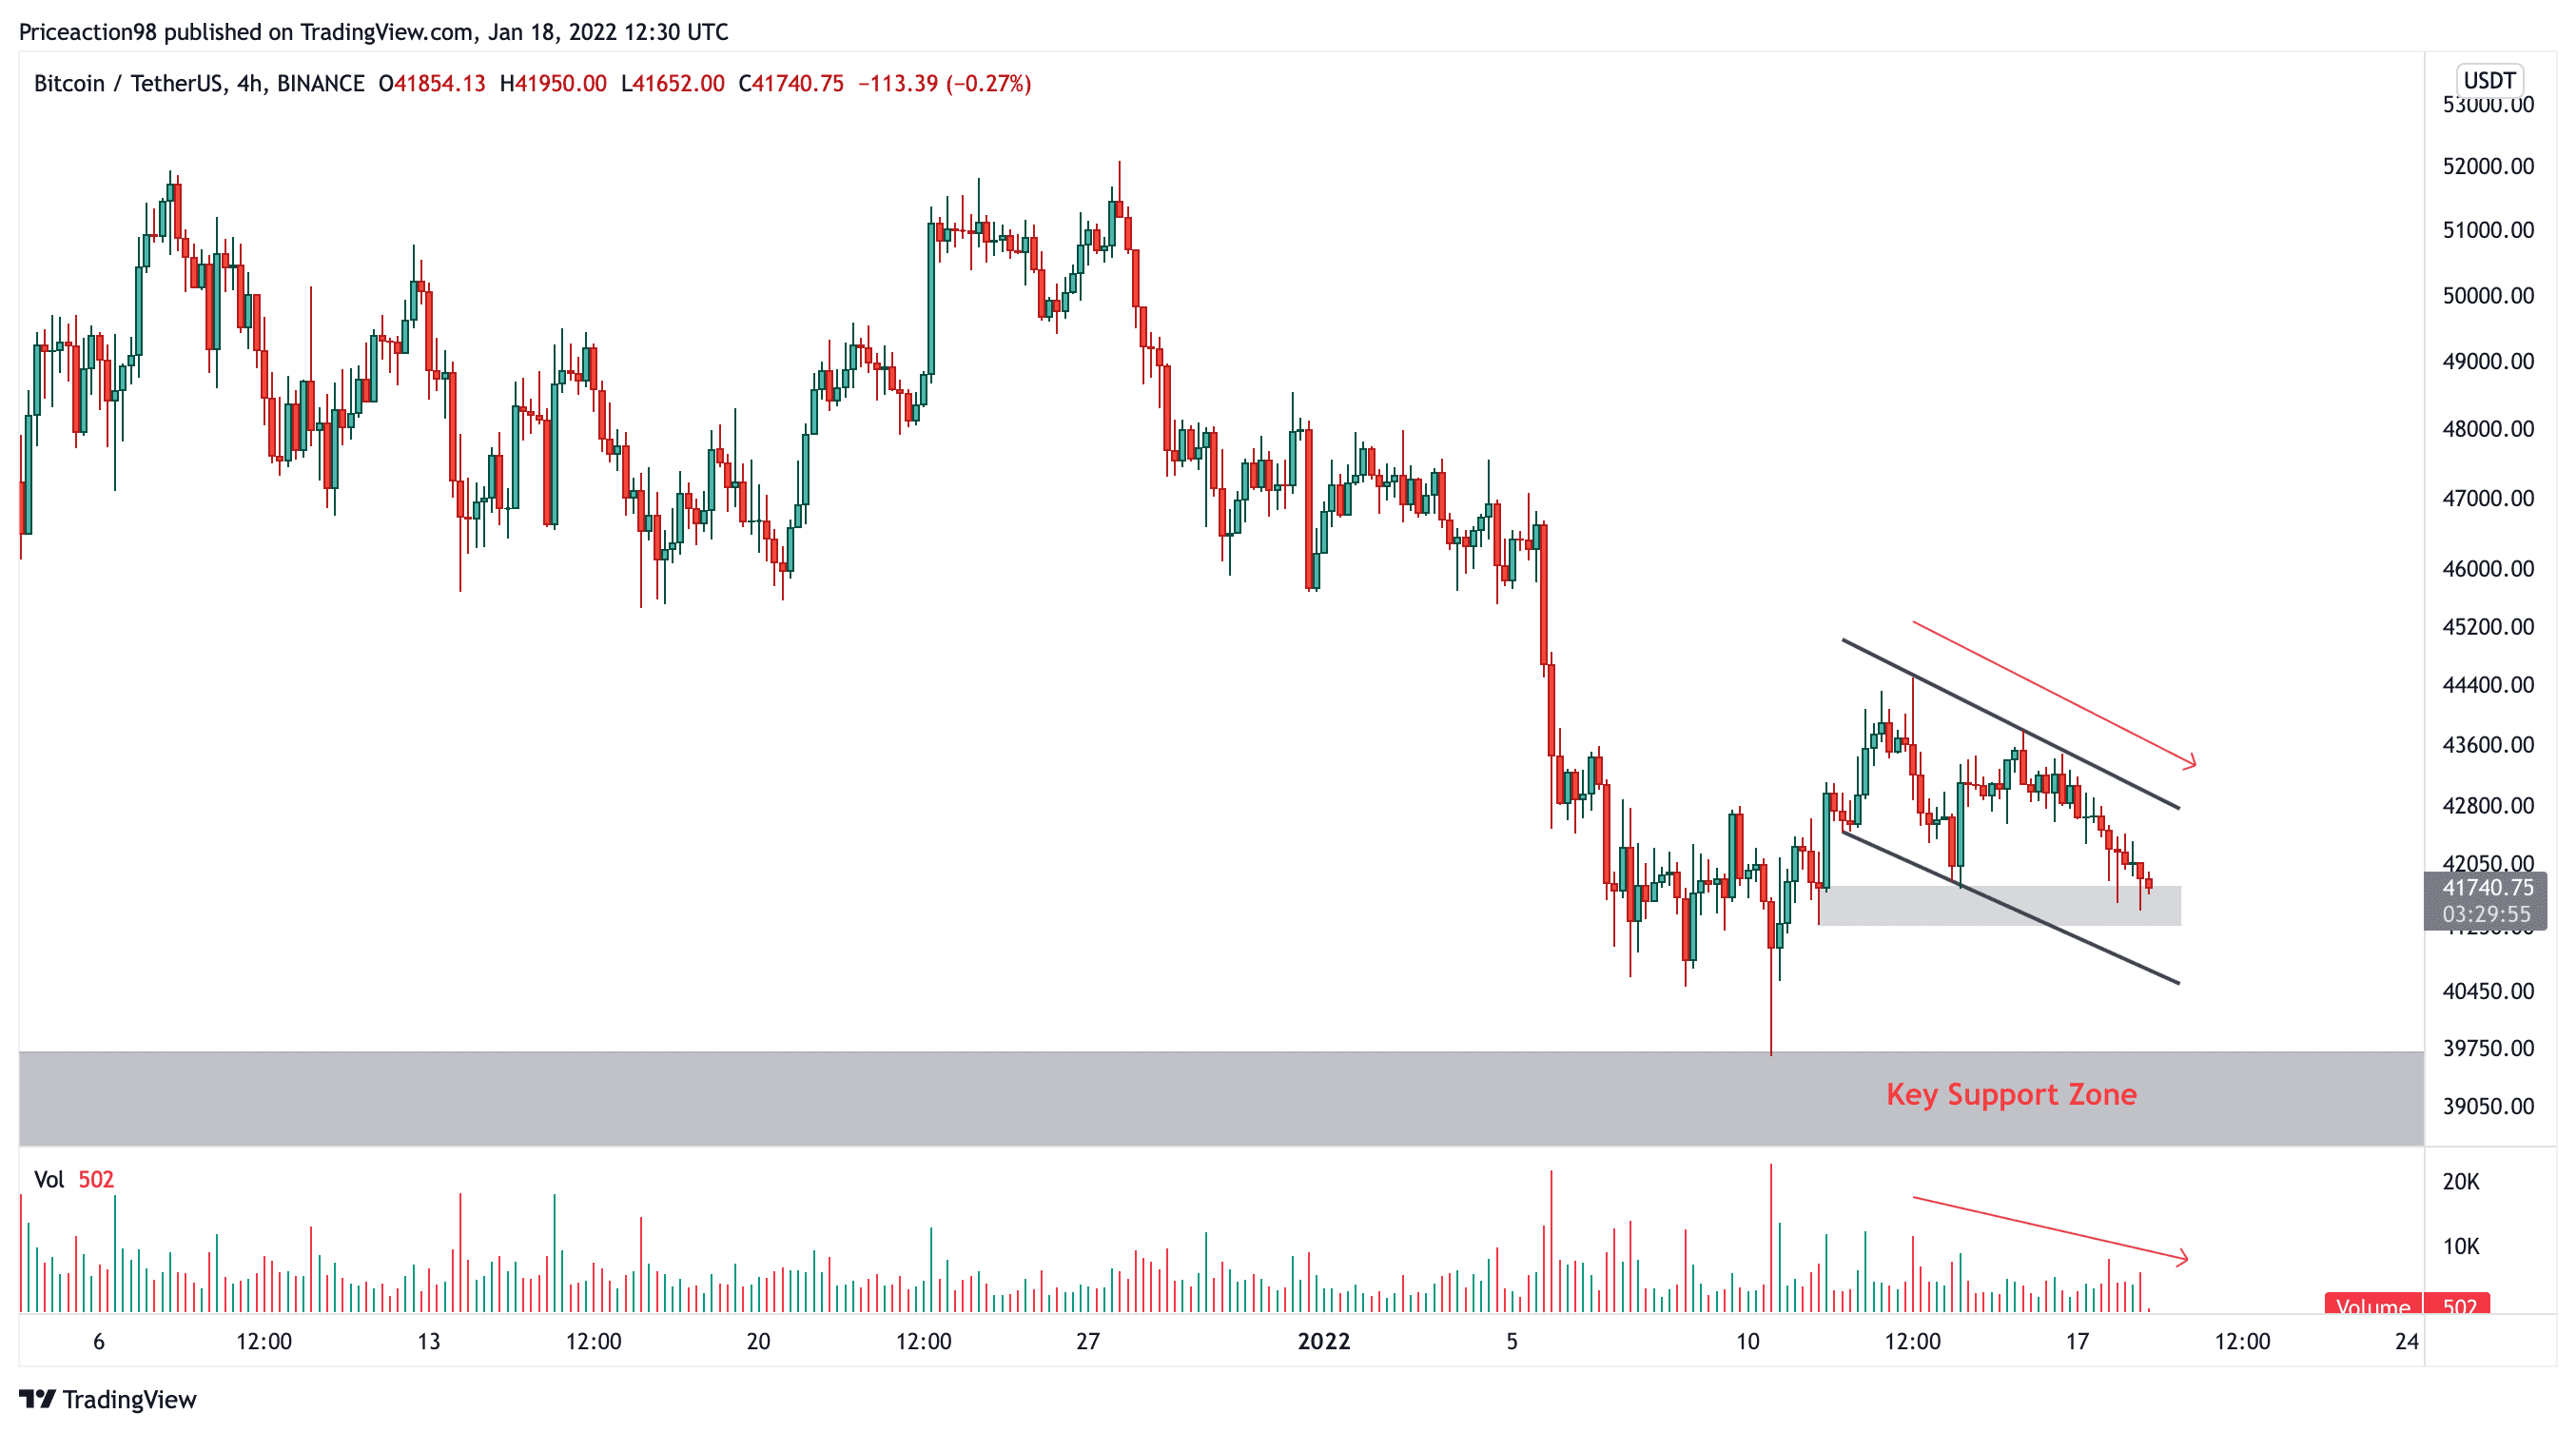
On the 4-hour time frame, we can witness the price correcting and potentially forming a bullish flag after the rejection by the $40K floor level.
Interestingly, the volume is decreasing as the price is slipping, which may be bullish, indicating that the bearish momentum is weakening.
We should closely observe the price’s reaction to the current support area on the lower timeframe when the price reaches the lower angle of the flag over the next few hours/days.
Suppose BTC loses those two potential support levels. In that case, a retest of the $37K area seems imminent, as the bulls will have to stand their ground against the selling pressure caused by retail traders and the over-leveraged longs which are getting liquidated.
Onchain Analysis
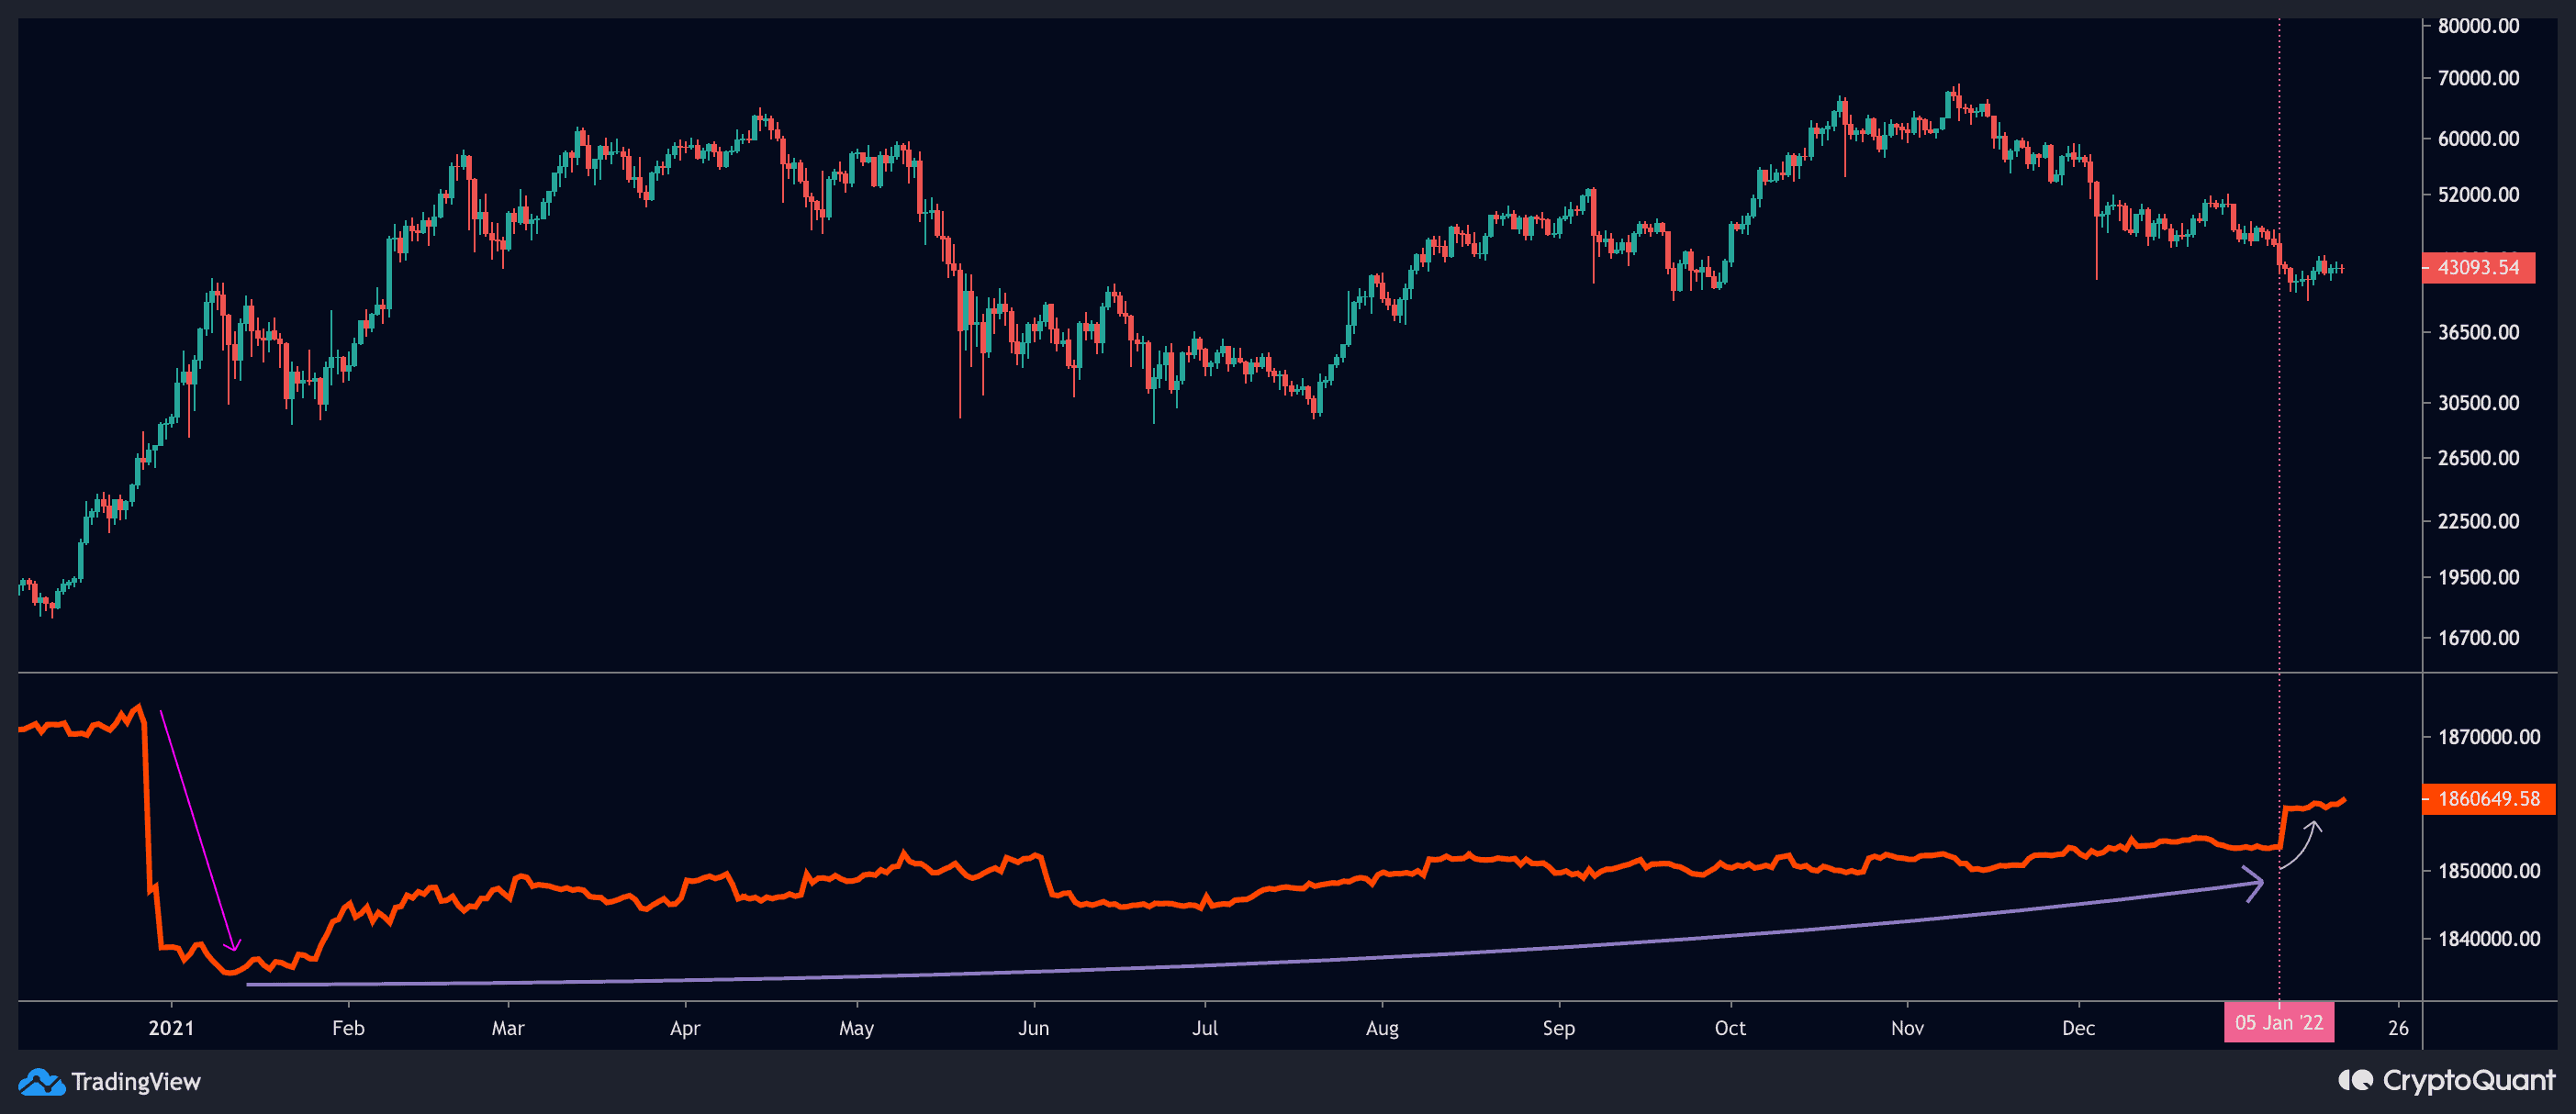
In December 2020, most bitcoin miners cashed out a considerable portion of their holdings. They changed their strategy after the price initially broke above the $42K mark in January 2021.
Since then, miners have begun to HODL. In early December 2021, they even accelerated their BTC accumulation. As a result, the balance of miners’ reserves had recorded a six-month high.
Onchain analysis by @Shayan: Technical analysis by @Edris
Binance Free $100 (Exclusive): Use this link to register and receive $100 free and 10% off fees on Binance Futures first month (terms).
PrimeXBT Special Offer: Use this link to register & enter POTATO50 code to get 25% off trading fees.
Disclaimer: Information found on CryptoPotato is those of writers quoted. It does not represent the opinions of CryptoPotato on whether to buy, sell, or hold any investments. You are advised to conduct your own research before making any investment decisions. Use provided information at your own risk. See Disclaimer for more information.
Cryptocurrency charts by TradingView.