The euphoric sentiment of October and early November has long since evaporated. The early December drop in the crypto market saw the price of Solana drop below the $200 mark, and since then the price established a shift in market structure to bearish. Repeated waves of selling have brought Solana prices to $90 at the time of writing, but the pain for late buyers holding on for dear life might not end yet.
Unless the wider market sentiment shifts, Solana could be a risky asset to buy. A recent congestion issue did shake some investors’ faith, which the Solana cofounder Raj Gokal was quoted at the time to have said the network was only “slightly slower for a while” and not “critically flawed”.
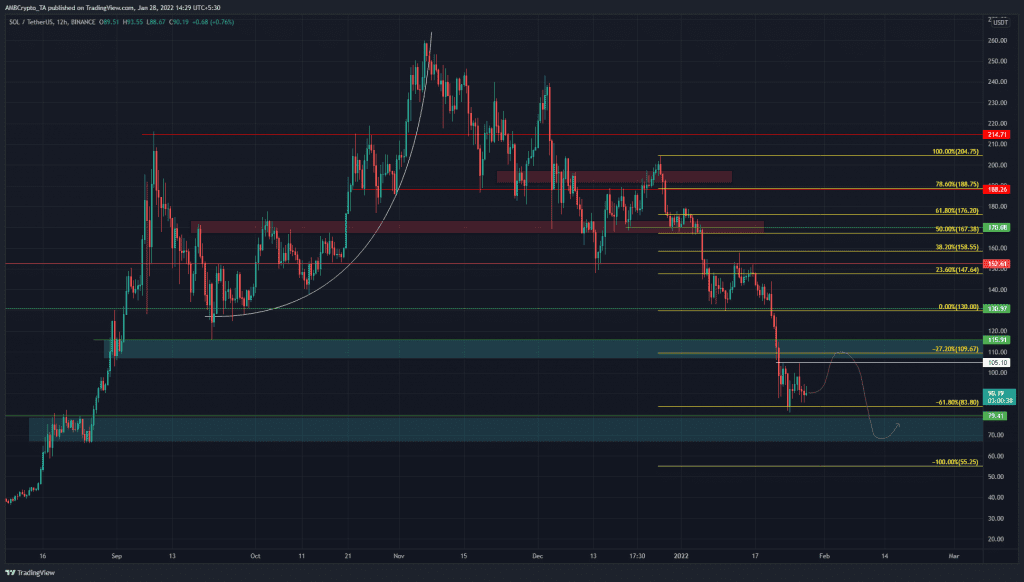
Source: SOL/USDT on TradingView
The Fibonacci retracement and extension lines (yellow) were plotted based on SOL’s drop from $204.75 to $130. The 61.8% extension level has seen a temporary stall in the descent of SOL on the charts.
The candlewicks to $105.1 (white) represent a set of local highs that SOL would have to climb above to flip the market structure on lower timeframes. However, above this level lies the 27.2% extension level at $109.67, which coincided with an area of demand (upper cyan box).
Since the price always seeks liquidity, it was possible that SOL would test this $110 area and fool some market participants into buying, before reversing back toward the $70 area in search of demand (lower cyan box).
Rationale

Source: SOL/USDT on TradingView
The 12-hour RSI has been below neutral 50 in recent weeks, which showed bearish momentum and the presence of a downtrend. It did show a slight bullish divergence in the past few days, which saw SOL bounce to the $105.1 mark before receding. At press time, the RSI found some support at 30 and appeared to be climbing.
The Cumulative Delta Volume indicator showed that selling volume has been strong in the month of December, and no divergence was seen between the CDV and the direction of the price movement.
The Directional Movement Index also showed a strong bearish trend in progress as both the ADX (yellow) and the -DI (red) were above the 20 mark.
Conclusion
The price could climb higher, or it might drop toward the $70-$78 area after a period of sideways trading at the $90 mark. In either case, it appeared likely that another leg down could be in store for Solana. The hawkish Fed comments recently, coupled with stocks and Bitcoin seeing strong selling pressure meant that the market conditions were not favorable to bulls.