The global market cap surged slightly over the last 24 hours as it reclaimed the $1.8T-level. Thus, Ethereum, Dogecoin and VeChain witnessed a marginal recovery while the onus was still on the king coin to alter the broader outlook.
These cryptos still need to infuse volumes while the buyers endeavored to give impetus to the recovery phase.
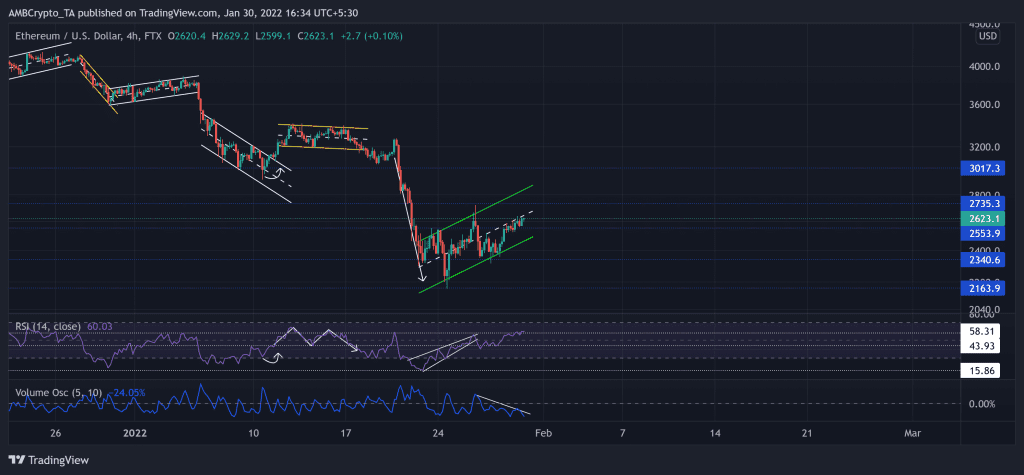
Ether (ETH)
After the recent sell-off, the alt lost $3000, $2700-mark supports while the bears flipped them to resistance. As a result, ETH registered a 33.84% loss (from 20 January high) and touched its six-month low on 24 January.
Over the past few days, the king alt consolidated in an up-channel (green), forming a bearish flag on its 4-hour chart. The immediate resistance continued to stand near the half-line of the up-channel (green).
At press time, ETH was trading at $2,623.1. Following the broader sell-off, the RSI saw an impressive 43 point revival from its 22-month low (on 22 January). It finally crossed the midline and tested the 58-mark thrice in the last two days. But, the volume oscillator fell below the zero-line, depicting a weak bullish move.
Dogecoin (DOGE)

Source: TradingView, DOGE/USD
The altcoin saw a 41.18% retracement and hit its nine-month low on 22 January. Since then, the recovery phase marked an up-channel (yellow, reversal pattern) while testing the $0.1456-mark immediate resistance.
The buyers showed up at the $0.1379-level and stalled the ascending channel breakdown. Following the same, the alt’s recovery halted at the 50 EMA near the $0.1456-level. Any further retracement would find testing grounds at $0.1379.
At press time, DOGE was trading at $0.1428. After the most recent revival, the RSI was finally able to sustain itself above the midline over the past day. But, it still faced resistance near 54-mark. Also, the northbound CMF crossed the zero line and revealed a bullish bias. However, the ADX depicted an extremely weak directional trend for the alt.
VeChain (VET)

Source: TradingView, VET/USDT
As the bearish vigor prevailed, the bulls even failed to defend the $0.05856-mark resistance (previous support). VET lost 41.1% of its value (from 20 January) and plunged toward its 11-month on 24 January.
Over the past few days, VET formed a bearish flag on its 4-hour chart. Now, the bears kept testing the lower channel for the past two days. Any bullish comebacks would find a ceiling at $0.05856-mark.
At press time, VET was trading above its 50-200 SMA at $0.05488. The RSI still needed to find a close above the 57-mark to confirm a strong recovery. The CMF skewed in favor of the buyers after a sharp uptrend over the last day. However, the OBV could not correspond with the recent spike, hinting at a possible slowdown.