As the broader sentiment seemingly improved, the 4-hour RSI of Shiba Inu, Chainlink, and EOS jumped above the crucial midline resistance. However, Shiba Inu continued to face a hurdle at the $0.00002233-mark after forming a symmetrical triangle.
On the other hand, LINK bulls strived to challenge the $17.7-mark while EOS hinted at slightly decreasing buying power.
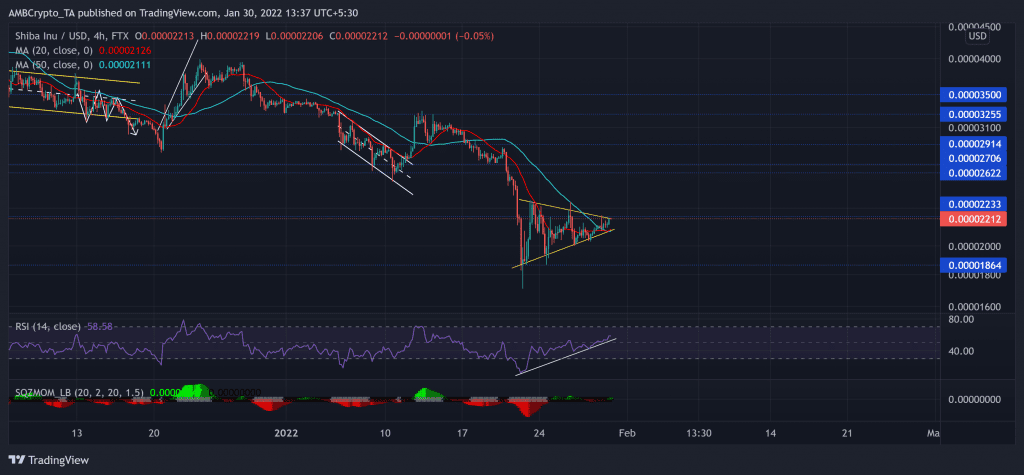
Shiba Inu (SHIB)
Since breaking down from the rising wedge (white), SHIB army has failed to counter the selling pressure. The alt persistently declined and lost half its value (from 27 December) until it plunged towards its 15-week low on 22 January.
Then, it saw a reversal rally after the buyers stepped in at the $0.00001864-level. Now, the meme token saw a symmetrical triangle (yellow) on its 4 -hour chart. The immediate resistance stood at the upper trendline that coincided with the $0.00002233-level.
At press time, SHIB was trading at $0.00002212. The RSI bounced back from the oversold region after touching its record low of 12.35. It revived by over 44 points this past week to cross the midline. It pictured a bullish bias while testing its trendline support. Furthermore, the Squeeze Momentum indicator has been in the low volatility phase for nearly a week now.
Chainlink (LINK)

Source: TradingView, LINK/USDT
While the sellers stepped in at the $25.75-zone, the alt nosedived by 48.56% to poke its six-month low on 24 January. Since then, the buyers have ensured the $15.6-mark as the alt recorded 33% recovery until press time.
After its recent gains, its 4-hour 20 SMA (red) bullishly converged with the 50 SMA (green). This reading depicted increasing buying influence. Also, LINK noted an ascending triangle breakout that tested the $17.7-mark. Any further breakouts would find a ceiling near the $19.3-level. On the flip side, any pullouts would find a floor around the upper flatter trendline of the triangle.
At press time, LINK was trading at $17.61. After crossing the vital 45-mark, the alt’s RSI hovered in the overbought region. However, the OBV was yet to cross its resistance and confirm momentum in favor of the bulls.
EOS

Source: TradingView, EOS/USDT
The down-channel (white) breakout was short-lived due to the broader fallout on 21 January. As a result, EOS marked a 30.41% decline and touched its 22-month low on 24 January.
The alt saw a bearish flag on the 4-hour chart. Over the past 24 hours, the bulls tested the midline of the up-channel nearly four times. Accordingly, it became the immediate resistance for the buyers.
At press time, EOS was trading at $2.341. The RSI showed improvement signs finally sustained a close above the half-line. Further, the AO pictured slightly increasing selling momentum as it endeavored to approach the midline.