Over the past few days, Bitcoin climbed back toward the $39k, where there is some short-term supply. This was the area where the previous lower high was made, and Bitcoin was at a place where it would have to make a decision once more- can bulls drive the price higher, or are the bears loading their sell orders?
At the same time, Bitcoin was climbing the charts, TRON was making some gains as well. TRON might be able to flip the previous near-term highs to support and could look to run as high as $0.063 and $0.066 if it could flip the $0.06 area to demand.
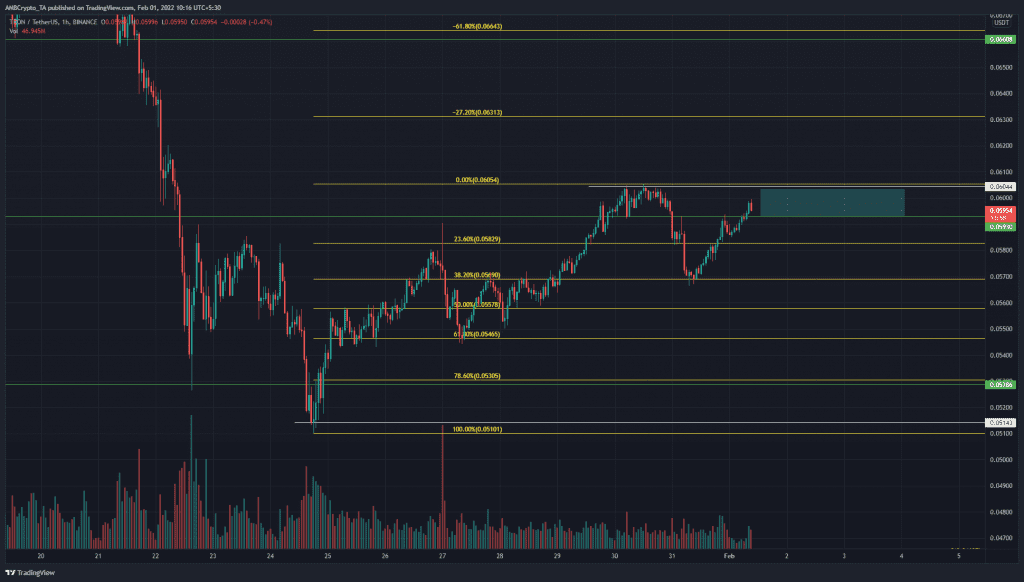
Source: TRX/USDT on TradingView
Using the move from the lows at $0.051 to $0.0605, a set of Fibonacci retracement levels (yellow) were plotted. On higher timeframes, TRON continued to remain bearish. However, the 1-hour chart showed that the previous bearish market structure was broken. At the time of writing, the previous higher high at $0.0604 (white) was the level for TRX to beat and flip to demand.
Hence, the $0.06 area (cyan box) was an area to look out for. Either TRX faces a rejection at this area in the next couple of days, or it makes a short-term higher high and retests this box in search of buyers. A flip to demand could mean that TRX is set to move to the $0.063 and $0.066 levels, which represent the 27.2% and 61.8% extension moves for the Fibonacci levels plotted.
The $0.0593 level of support also held some significance from a longer-term outlook, which meant this level could see buyers once again in the next few days.
Rationale

Source: TRX/USDT on TradingView
The RSI on the hourly climbed past the neutral 50 mark and showed strong bullish momentum in the past couple of days. This would need to be sustained for TRX to move higher toward $0.063 and $0.066.
The Stochastic RSI was in the overbought territory, while the Awesome Oscillator climbed back above the zero line and registered green bars on its histogram. This showed strong upward momentum on the hourly chart.
Conclusion
Momentum was bullish and the previous high could be broken and retested, which would present a buying opportunity at the $0.0604 level. However, Bitcoin was at the $38.5k resistance area and would need to climb past $39k and $40.6k to instill further confidence that TRX could indeed climb as high as $0.066. However, the longer-term trend (4-hour and higher) continued to remain bearish for TRX.