Any bear run concerning a digital asset like Bitcoin is a scary phase. There remains an uncertainty of a price recovery or even possibilities of a further decline. Bitcoin was down as much as 40% from recent highs. Many fear the onset of a prolonged bear market – similar to the bear runs in the 2018 era.
Worst case scenario
Bitcoin, the largest crypto witnessed a massive drop in 2021 end, even 2022 was no different. Last month, the Fear and Greed Index dropped to an alarming rate. It stood at 22, depicted ‘extreme fear’. At present, BTC had recovered both in price and F&G sentiment (at 51 = Neutral).
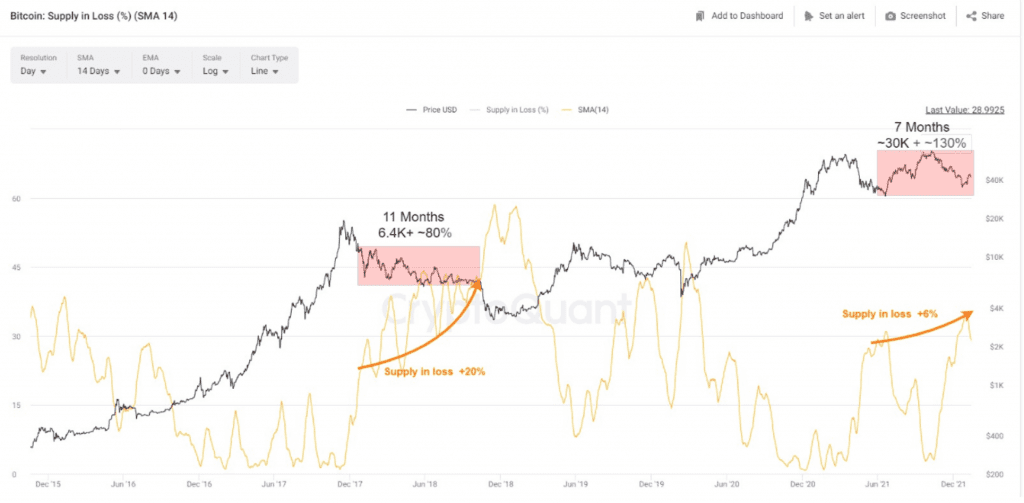
CryptoQuant, the quantitative research firm shed light on this with a report. According to the firm, the last 2 big bear markets were in 2017-18 and 2020. But those markets had specific characteristics to them than the current one. Consider this graph below that analyzed Bitcoin’s supply in a loss.
Source: CryptoQuant
Here, in 2018’s bear run (lasted for 11 months), the floor price was “~ $6.4K involving multiple ‘DeadCatBounce‘ with up to 80% rebounds. During this bearish phase, the percentage of supply in loss grew +20% due to the BUY/HODL at prices above ~$6.4K.” Compared this to the aforementioned situation, the report noted:
“Assuming the second ATH was a dead cat bonus in a bear market, so far percentage of supply in loss has grown +6% while we had a +130% rebound to $69K. Therefore, a lengthier bear market is not out of the picture.”
Ergo, for a nightmare scenario, Bitcoin could bottom to $29K. However, the current recovery did create a lot of bullish projections. At press time, Bitcoin rose above the $44k level with a 1.2% surge.
HODL on
After huge increases of coins going to exchanges in the 2018 and 2020 bear markets, now, the ‘Exchange reserve‘ was flat. There’s almost the same number that was there a year ago. So while people are fearful, they were HODLing on.

Source: CryptoQuant
The Net HODLer position grew meaning HODLers are HODLing for longer. On the contrary, the 2018 bear market and mid-late 2020 when more holders were spending their coins instead of HODLing.
Even the Stablecoin Supply Ratio (SSR) painted a ‘Bullish’ picture. The team in a series of tweets had shed light on this indicator and its green signal as seen on the graph below.
1/ Stablecoins Supply Ratio indicates there are relatively many stablecoins compared to Bitcoin’s supply.
“Stablecoin Supply Ratio Bullish Signal” by @TradingRage https://t.co/mopygsoHPc
— CryptoQuant.com (@cryptoquant_com) February 14, 2022
Another fellow Glassnode alum, TXMC argued:
When I consider everything #BTC HODLers withstood in 2021-
When I observe global de-risking for 3+ months-
When I see 48% of Realized Cap STILL held from 3-12 months ago after a $33k scare-
I ask: with all existing FUD priced in, barring surprises, who remains to sell here? pic.twitter.com/nsJ6a5tG7p
— TXMC (@TXMCtrades) February 15, 2022
The accompanying chart highlighted coins that last moved between three and six months ago — the run-up to the $69,000 all-time high — growing as a proportion of the overall BTC supply.
Hey Google, tell me a joke
Here’s one. Despite the recovery and bullish indicators, interest in Bitcoin stayed practically negligible from mainstream sources. Google Trends data showed a distinct lack of curiosity/excitement from users.

Source: Google Trends
Despite what one might see in portfolios- we weren’t in a bear market. Could we be eventually? Maybe.