SHIBA INU (SHIB) has been moving upwards since Jan 22. However, due to the weakness of the upward movement, it has yet to confirm its bullish reversal.
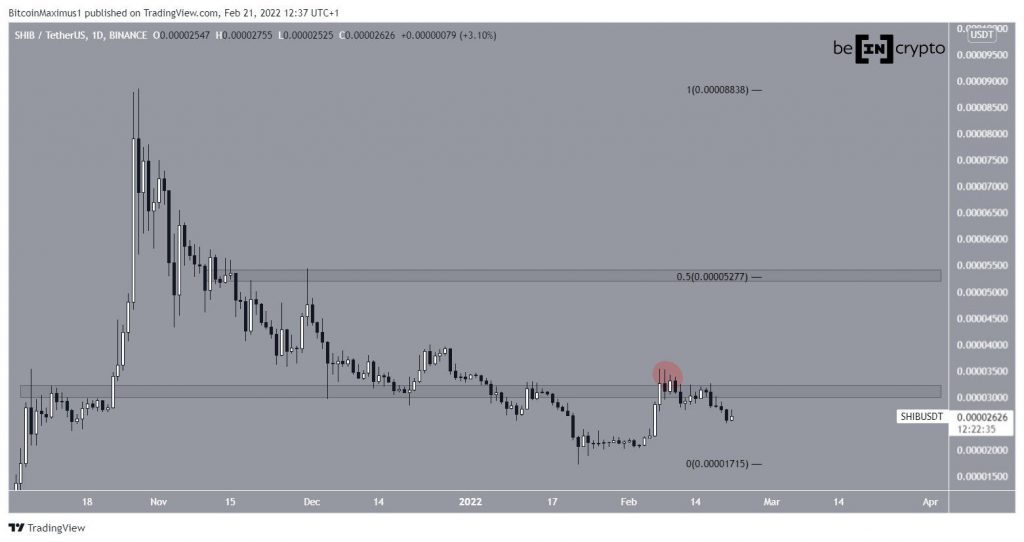
SHIB has been falling since reaching an all-time high price of $0.000088 on Oct 28. The downward movement led to a low of $0.000017 on Jan 22. This amounted to a decrease of 80% measuring from the high.
While SHIB initiated an upward movement afterwards, it failed to reclaim the $0.000031 horizontal area, rather deviating above it (red circle) before another fall.
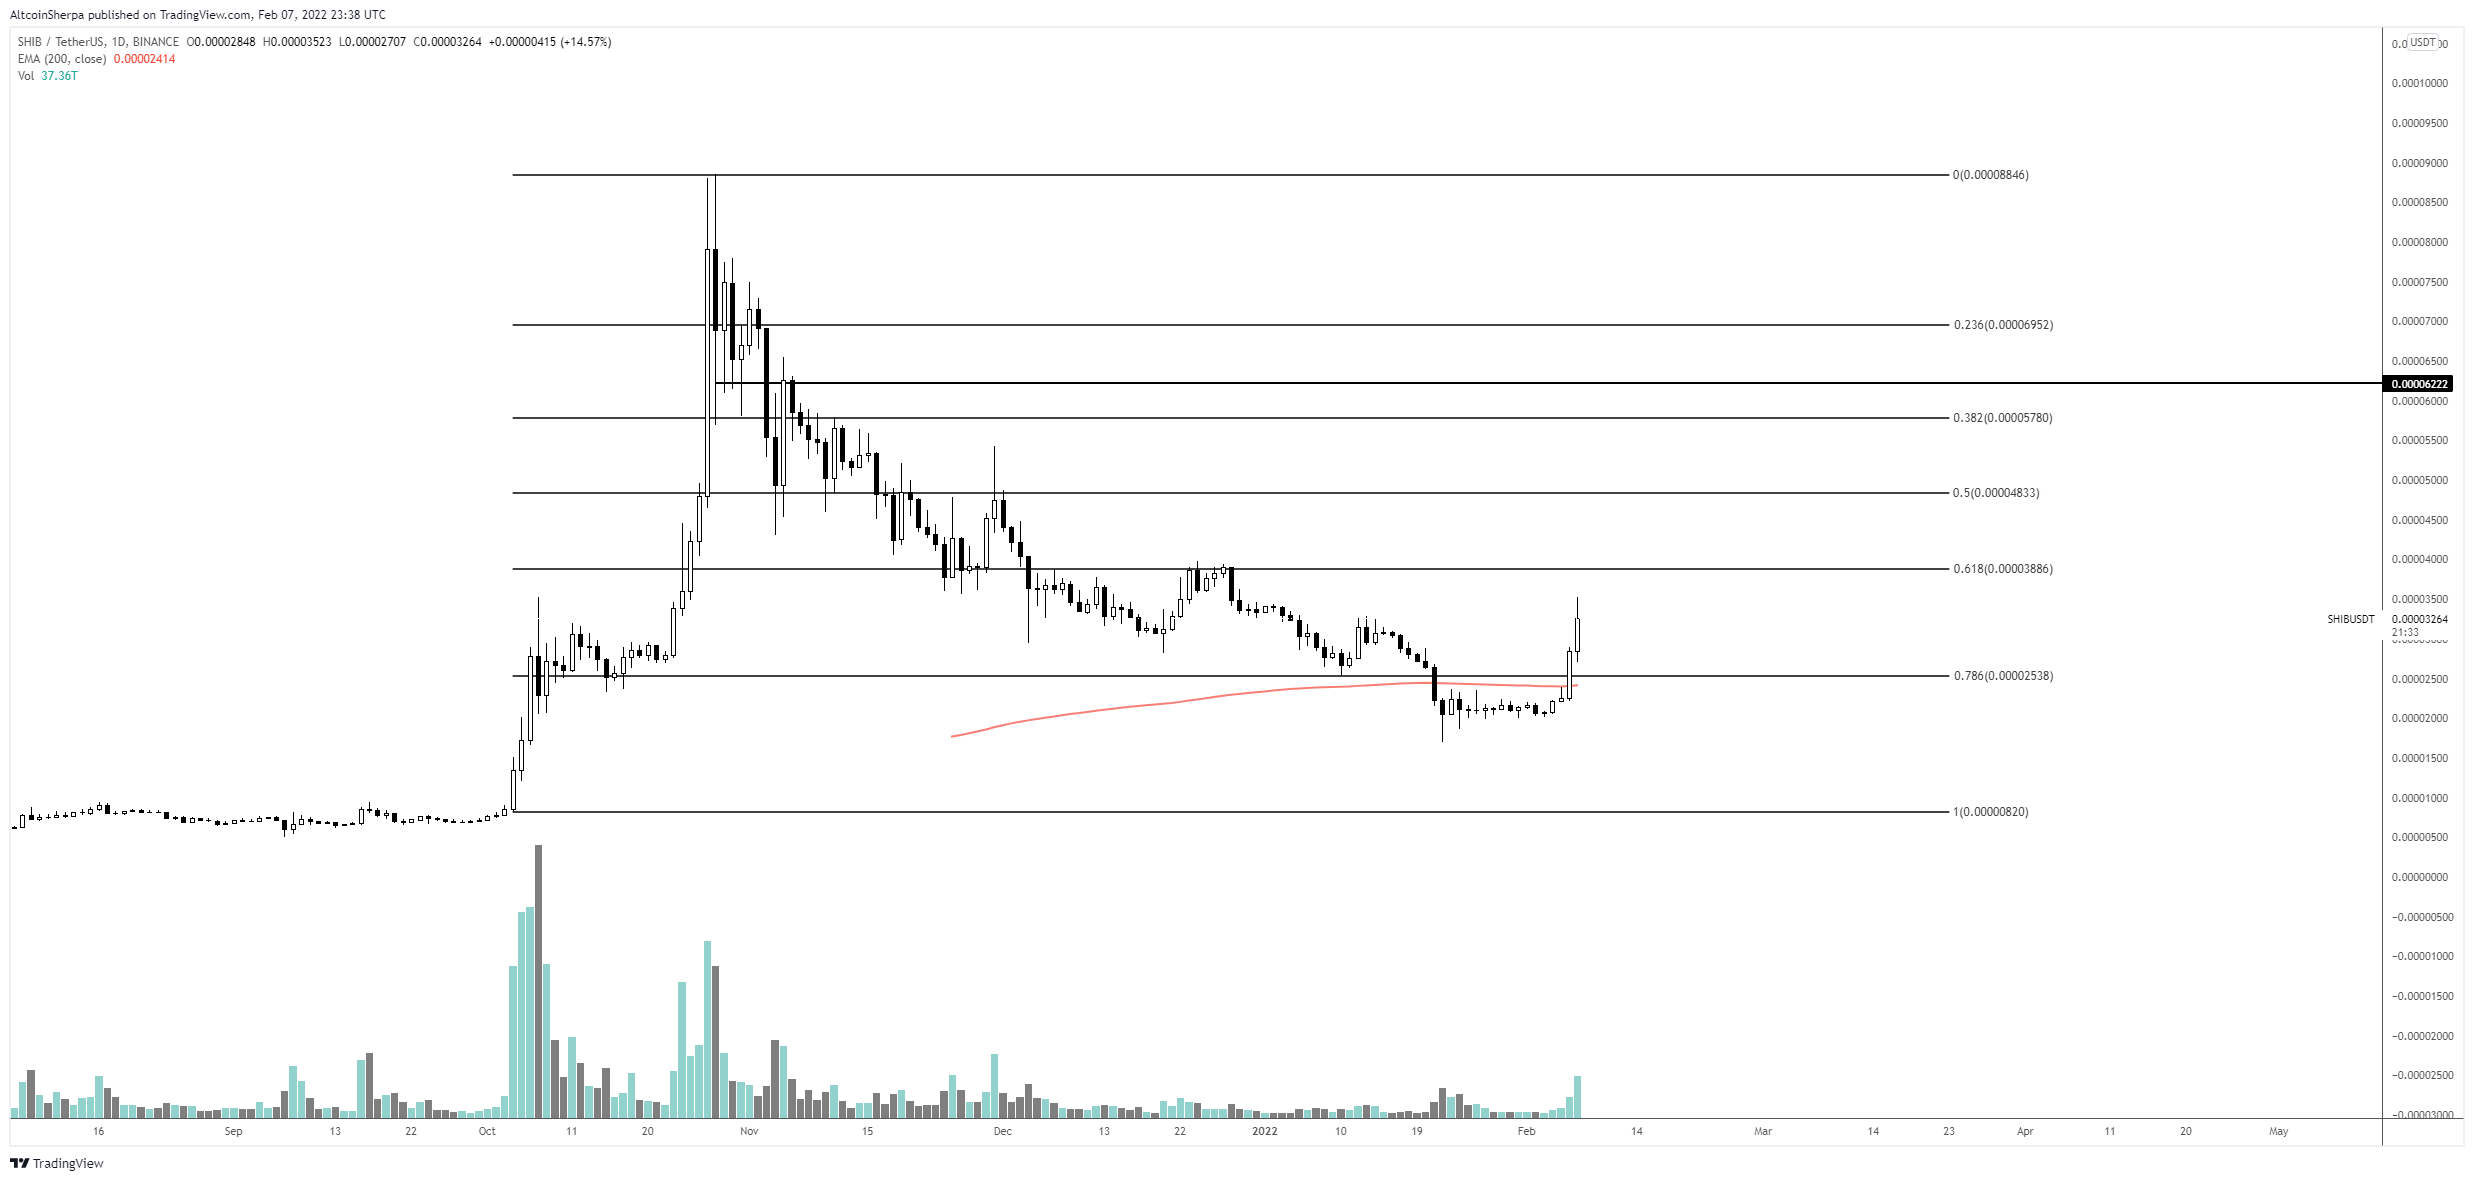
Cryptocurrency trader @Altcoinsherpa tweeted a chart of SHIB, stating that the price has begun an upward movement measuring from the January lows. Since the tweet, SHIB has been rejected by the $0.000031 horizontal area and begun a downward movement.
Will SHIB break out?
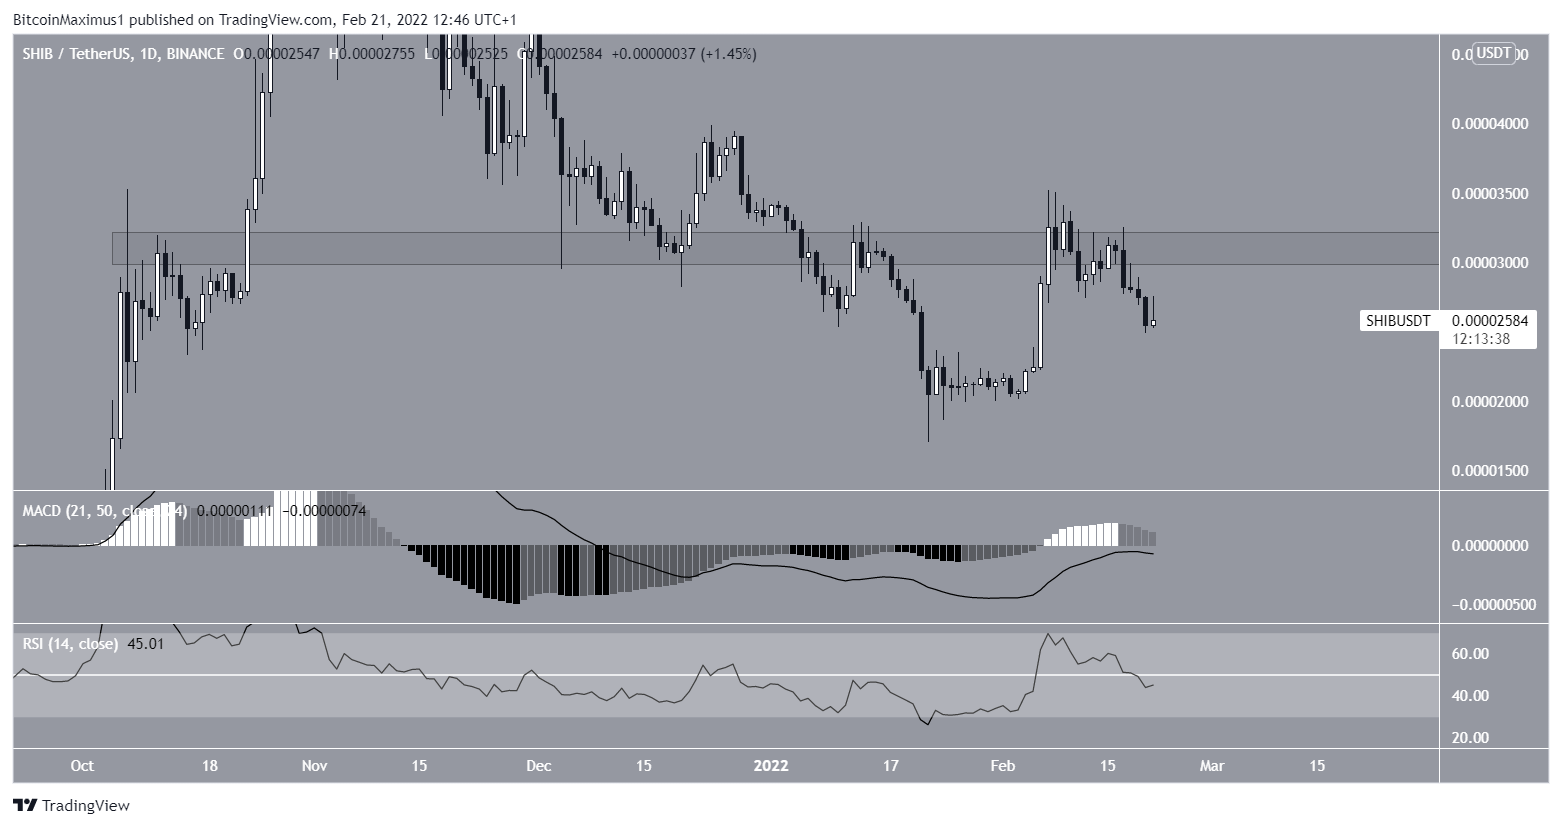
Technical indicators in the daily time-frame fail to confirm the direction of the trend, since they provide mixed readings. This is visible in both the RSI and MACD.
The RSI, which is a momentum indicator, has just fallen below 50. This is considered a sign that the trend is gradually turning bearish. Furthermore, it renders the previous increase above this level as only a deviation.
The MACD, which is created by a short- and a long-term moving average (MA), is still negative. This means that the short-term MA is slower than the long-term one.
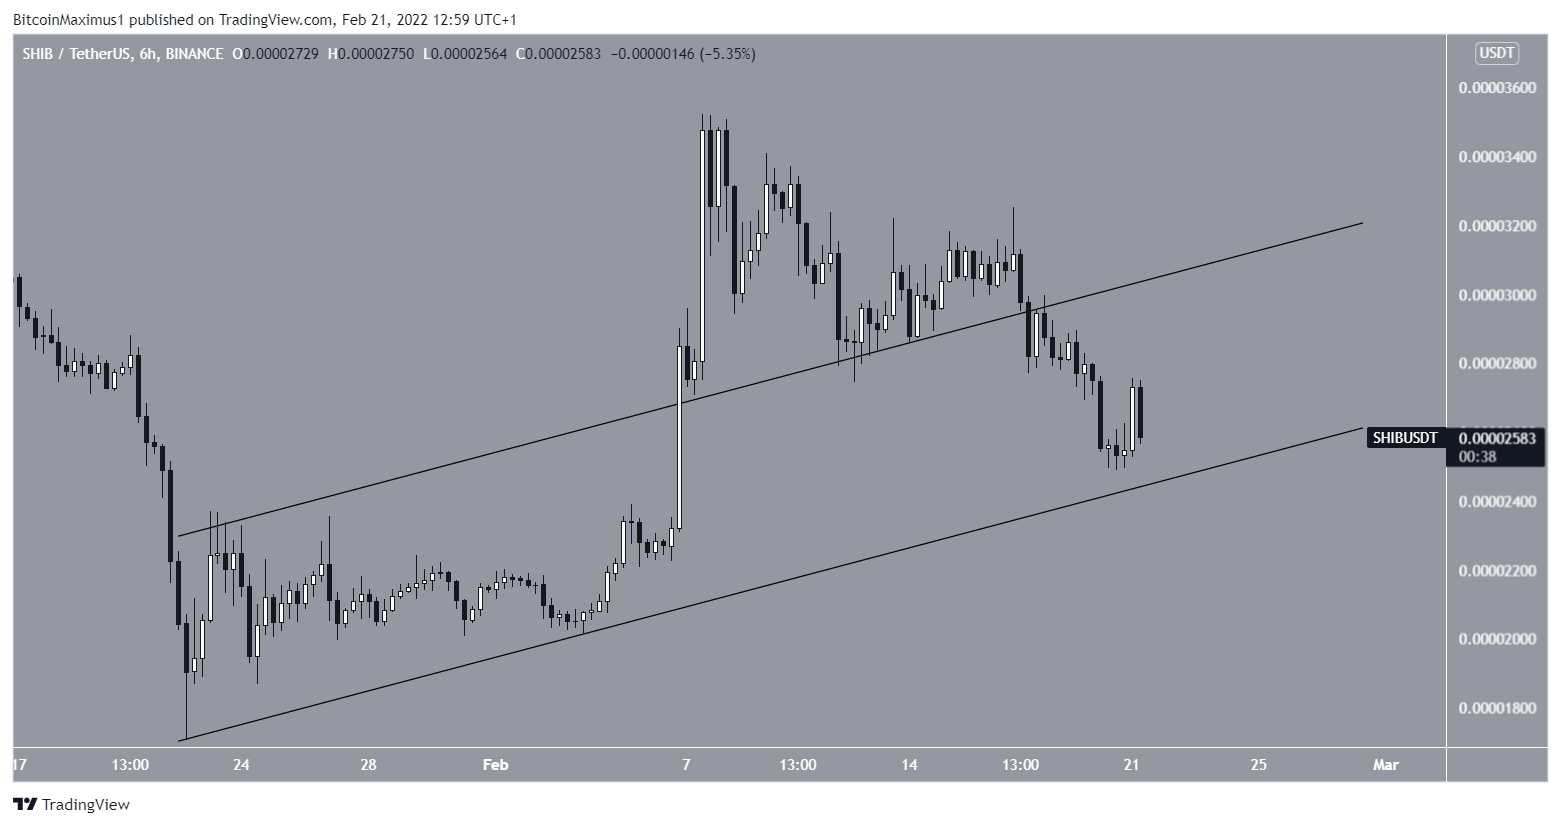
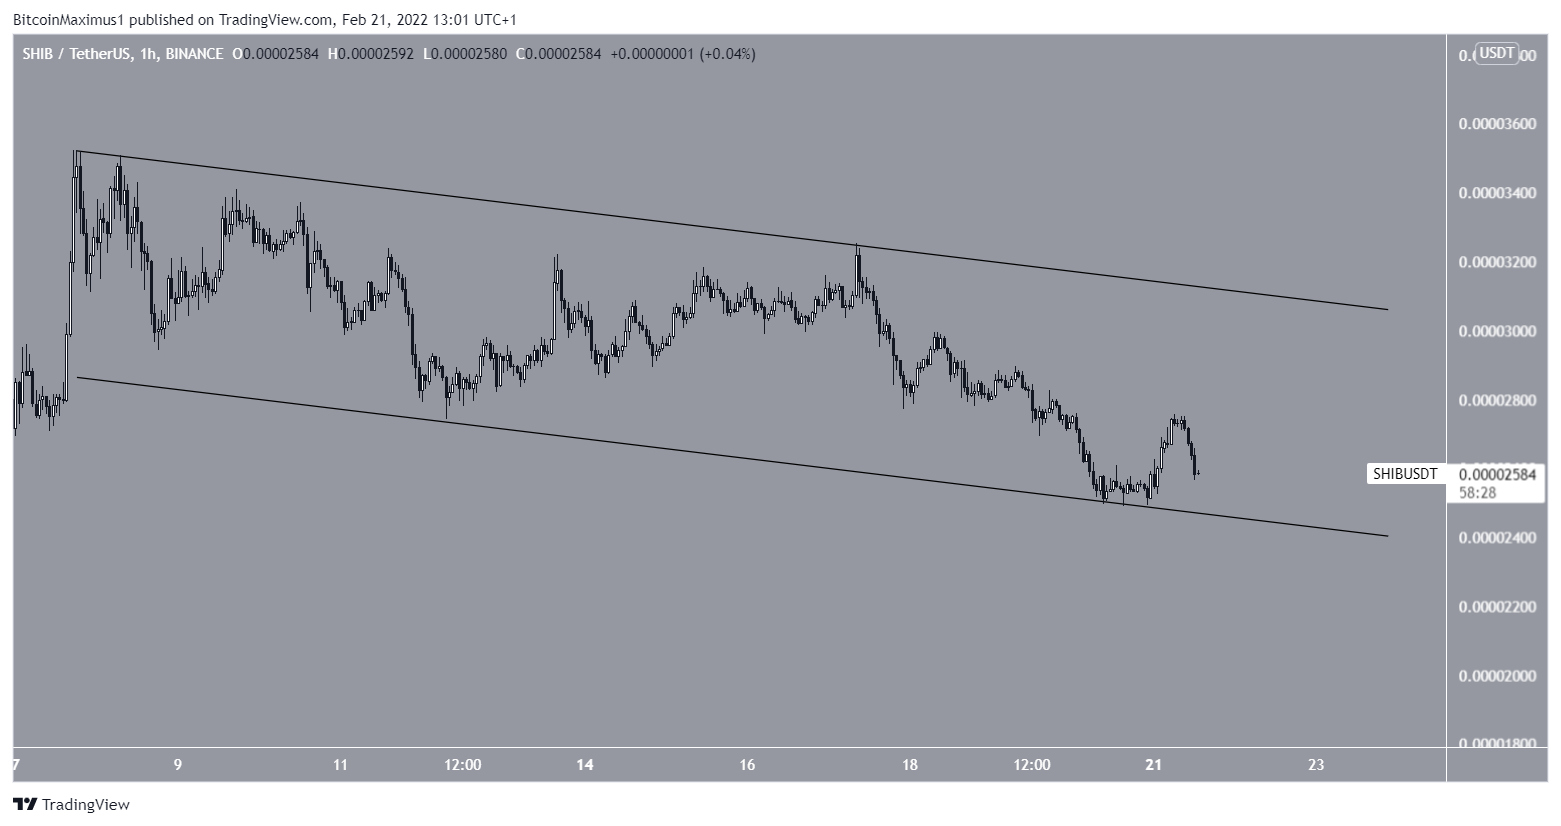
The six-hour chart shows that SHIB previously broke out from an ascending parallel channel on Feb 7. Since the upward movement could not be sustained, the price fell back into this channel on Feb 17 and is currently trading close to its support line.
Therefore, it is possible that SHIB could bounce at this level.
This is supported by the two-hour chart, which shows a descending parallel channel. SHIB is currently right at the support line of this channel.
Therefore, the current area would be likely to initiate a reversal.
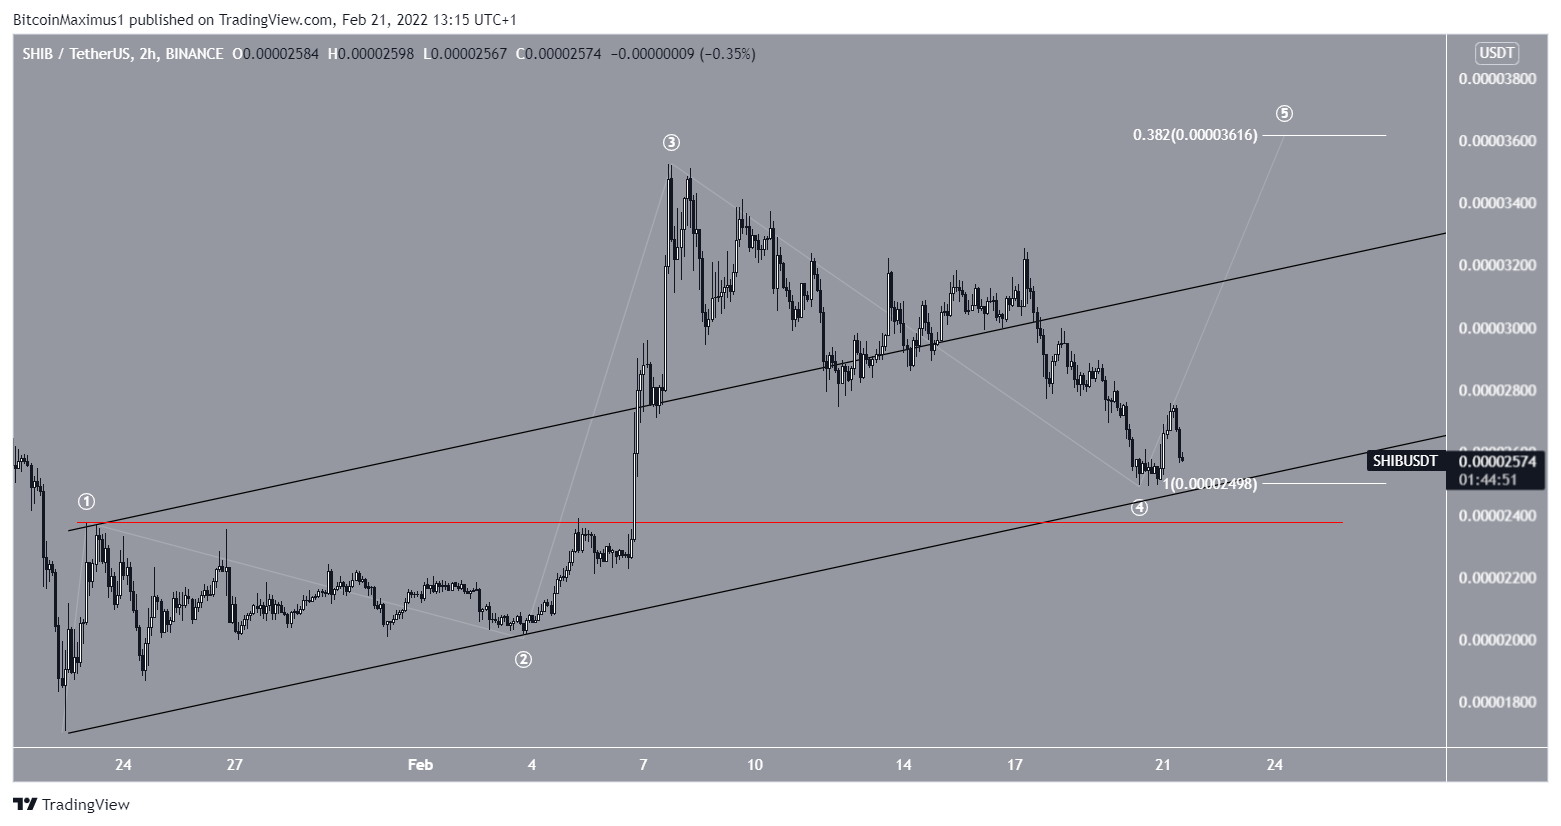
Wave count analysis
It is possible that the ongoing decrease is part of wave four of a five wave upward movement (white). In this case, SHIB is currently completing a fourth wave pullback. This is an occurrence in which a sharp drop is followed by the fifth and final wave.
A decrease below the wave one high (red line) at $0.000023 would invalidate this potential scenario.
Since wave three extended, it is possible that wave five will be small, ending just above the top of wave one.
For BeInCrypto’s latest Bitcoin (BTC) analysis, click here
Disclaimer
All the information contained on our website is published in good faith and for general information purposes only. Any action the reader takes upon the information found on our website is strictly at their own risk.