Disclaimer: The findings of the following analysis are the sole opinions of the writer and should not be considered investment advice
Since striking its all-time high on 7 January, Cosmos (ATOM) bears have stepped in to exert sustained pressure. Especially as the altcoin fell into a falling wedge (white) over the past month.
Assuming the willingness of the buyers to defend the $23-mark remains intact, ATOM should be aiming to test the $26-level before initiating a possible breakout of its wedge. Post the same, the long-term downtrend would likely give the bears an edge around the $28-resistance.
At press time, ATOM was trading at $24.21, down by 4.13% in the last 24 hours.
ATOM Daily Chart
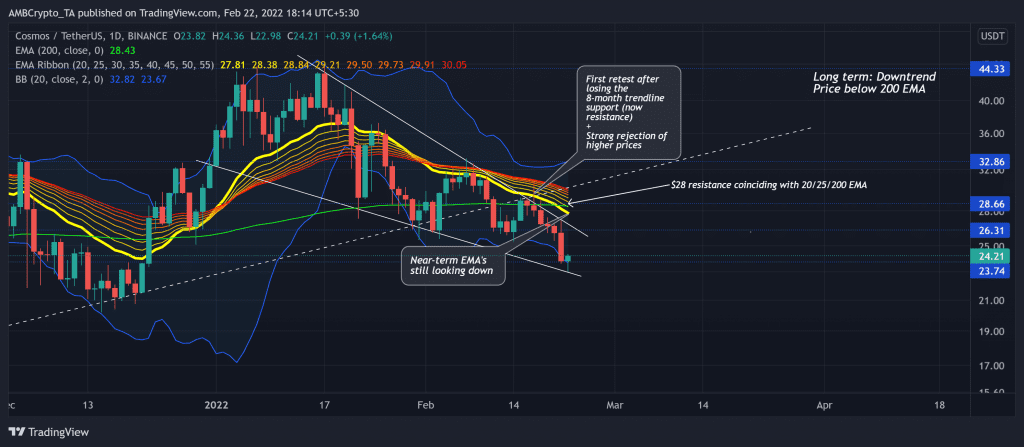
The recent bearish phase (from its ATH) led the alt to lose more than 45% of its value and plunge toward its two-month low on 22 February. As the eight-month-long trendline support flipped to resistance, it served as a strong selling point as ATOM reversed to further test the $23-support near the lower band of the Bollinger Bands (BB).
The downfall pushed the alt below all its EMA ribbons while the 20 EMA and the upper trendline of the wedge assumed sturdy resistance. Keeping in mind the recent rejection of higher prices and the widening gap between the EMA ribbons, the bears claimed to have a superior edge.
From here on, if the buyers vigorously defend the $23-mark, a further retest of its upper trendline before a possible breakout would be likely. If the buyers fail to sustain a rally, ATOM would find itself between the $23-$26 range in the days to come. As the long-term outlook still favors the sellers, the bulls need to counter the sell-off to keep the $28-retest hope alive.
Rationale

Source: TradingView, ATOM/USDT
The RSI poked its three-month low on 21 February and revived from its support as it endeavored to test the 39-resistance. Also, historically, it has seen a revival from this level. Thus, increasing the chances of challenging the above resistance.
The DMI lines affirmed the bearish edge due to the recent sell-offs. Nevertheless, the ADX continued to reveal a weak directional trend for the alt.
Conclusion
Considering the confluence created with the oversold readings on its Bollinger Bands and the lows of its RSI, the chances of testing the $26-$28-zone are bright before a pullback into its long-term downtrend.
Besides, an overall market sentiment analysis becomes vital to complement these technical factors to make a profitable move.