BeInCrypto takes a look at the price movement for seven different cryptocurrencies, including Helium (HNT), which has created a bullish pattern.
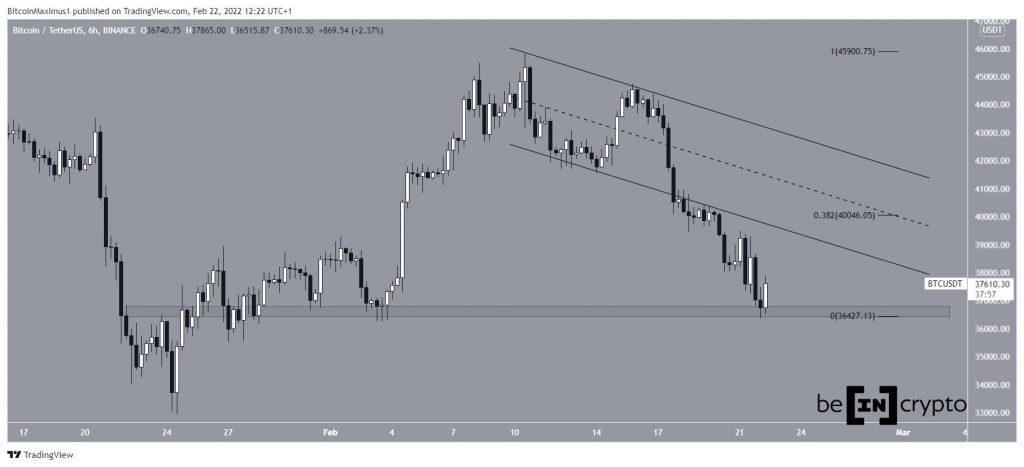
BTC
BTC has been decreasing inside a descending parallel channel since Feb 10. On Feb 18, it broke down from the channel and proceeded to reach a low of $36,350 on Feb 22.
Afterwards, the price bounced, validating the $36,500 area as horizontal support.
The previous support line of the channel is now expected to provide resistance. Afterwards, there is strong resistance at $40,050, created by the middle of the channel and the 0.382 Fib retracement resistance level.
ETH
Similarly to BTC, ETH has been falling since Feb 10. Two days later, it created what looks like a descending wedge.
While the wedge is considered a bullish pattern, ETH has fallen below the $2,600 horizontal area. This is a crucial level since it has previously acted as both resistance and support since Jan 26.
In order for the short-term trend to be considered bullish, ETH has to reclaim this level and break out from the wedge.

XRP
XRP has been falling since Feb 9. In the period between Feb 12 – 29, it seemingly halted its decrease and began a consolidation period. However, the downward movement accelerated on Feb 19, leading to a low of $0.66 three days later.
XRP has initiated a slight bounce at the $0.675 support since. This is both a horizontal support level and coincides with the support line of the previous ascending parallel channel.
Therefore, if the upward movement is to continue, XRP has to hold above this level.

NEO
NEO has been decreasing alongside a descending resistance line since Sept 6. While doing so, it broke down from the $26.50 horizontal support area on Jan 5. Afterwards, the area turned to resistance and rejected the price on Feb 19.
So far, NEO has decreased by 86% measuring from its 2021 highs.
The next closest support area is at $13.50.

LUNA
LUNA has been trading inside a descending parallel channel since Feb 7. Such channels usually contain corrective structures, meaning that a breakout from it would be the most likely scenario.
On Feb 12 and 20 (green icons), LUNA bounced at the support line of this channel. Currently, it is attempting to reclaim its midline.
If a breakout occurs, the most likely target for the top of the movement would be at $64.55. The target is found by projecting the length of the previous decrease (highlighted) to the Feb 20 bottom.

HNT
HNT has been decreasing inside a descending parallel channel since Feb 7. On Feb 22, it bounced at its support line (green icon) and the $21 horizontal support area.
When discounting the wick lows from Jan 24, this effectively created a triple bottom, which is considered a bullish pattern.
If a breakout occurs, the closest resistance area would be at $31.

NEAR
NEAR has been falling since Jan 14, when it reached an all-time high price of $20.60. So far, it has decreased by 58%, leading to a low of $8.21 on Feb 22.
On Jan 24, the price bounced at the previous descending resistance line, seemingly validating it as support (green icon). However, it broke down below the line on Feb 21 and validated it as resistance once more (red icon).
The closest horizontal support is at $8.

For BeInCrypto’s latest Bitcoin (BTC) analysis, click here
Disclaimer
All the information contained on our website is published in good faith and for general information purposes only. Any action the reader takes upon the information found on our website is strictly at their own risk.