As the broader market witnessed a 24-hour plunge, Litecoin lost the $105-level and depicted oversold readings on its 4-hour RSI. Furthermore, SAND’s decline found a floor at the $2.8-mark before showing some recovery signals. Also, Tron saw a bullish divergence with its RSI while the 38.2% Fibonacci resistance stood sturdy.
Litecoin (LTC)
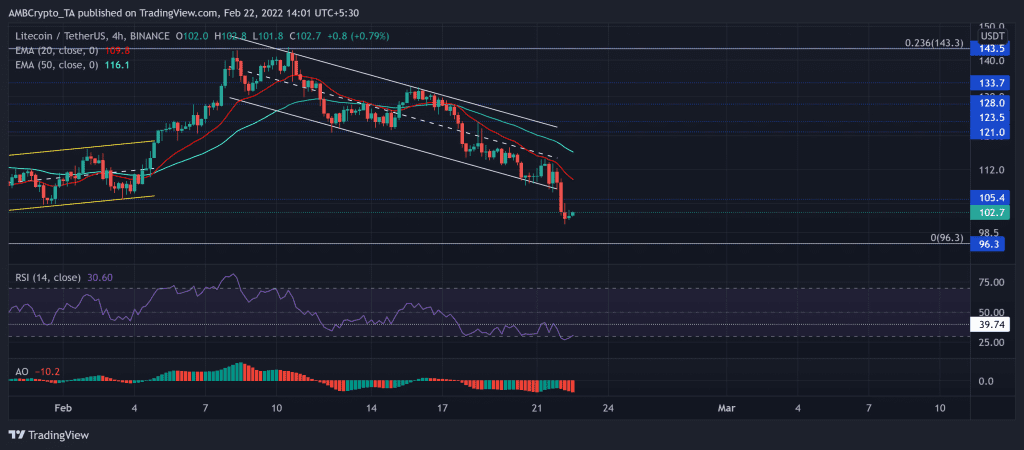
LTC’s previous 47.9% rally from its 13-month low halted near the 23.6% Fibonacci resistance. As a result, it reversed and lost over 28% of its value to date.
The alt witnessed a down-channel (white) on its 4-hour chart. As a result, the bears flipped the vital $105-mark from support to resistance. During this phase, the 20 EMA (red) stood as strong resistance while LTC broke down of the channel. Any bullish comebacks find a testing point near the $105-mark.
At press time, LTC was trading at $102.7. The RSI still hovered near the oversold region. A sustained close above this level would brace it for a 39-mark retest. The AO reaffirmed the bearish vigor after multiple bearish engulfing candlesticks over the last day.
Tron (TRX)

Source: TradingView, TRX/USDT
TRX witnessed a substantial 30% drop from (20 January) and touched its six-month low mark on 24 January. Since then, the alt recovered in an ascending channel (yellow) on its 4-hour chart.
It registered a nearly 40% gain to retest the 61.8% Fibonacci resistance on 10 February. Since testing this level, it saw a pullback while breaking out of the pattern. Since then, the bears breached the $0.06-mark while the alt saw a down-channel (white). Any close above the $0.06-level could propel a retest of the upper trendline of the down-channel.
At press time, TRX traded at $0.06035. The RSI moved sideways in the last five days while the price action steeply declined. Thus, forming a hidden bullish divergence. A close above 39-resistance would be crucial for a strong recovery phase.
The Sandbox (SAND)

Source: TradingView, SAND/USDT
The alt saw an over 90% ROI from its two-month low on 22 January until the $4.8-level. The rally after the up-channel breakdown could not breach this mark as the bears stepped in.
Since then, SAND has tested its three-week trendline support (yellow) until breaching it on 13 February. It flipped the $3.5-level from support to immediate resistance. The immediate testing point for the bulls stood near the 20 EMA (red).
At press time, SAND was trading at $3.0433. The RSI steeply dropped toward the 25-mark. The recent revival snapped its trendline resistance and eyed to challenge the 38-mark. With the gap between DMI lines decreasing, the bullish revival hopes in the near term were still alive.