There was an argument to be made that an XRP fractal could push the price past the $1 mark, as the coin went appeared to be in an accumulation phase on lower timeframe charts. On the longer timeframes, there were multiple levels of strong resistance to the upside for XRP bulls to overcome. In particular, the $0.76-$0.8 area could pose stiff resistance. If the price could push above this area, XRP bulls could drive prices higher in the weeks to come.
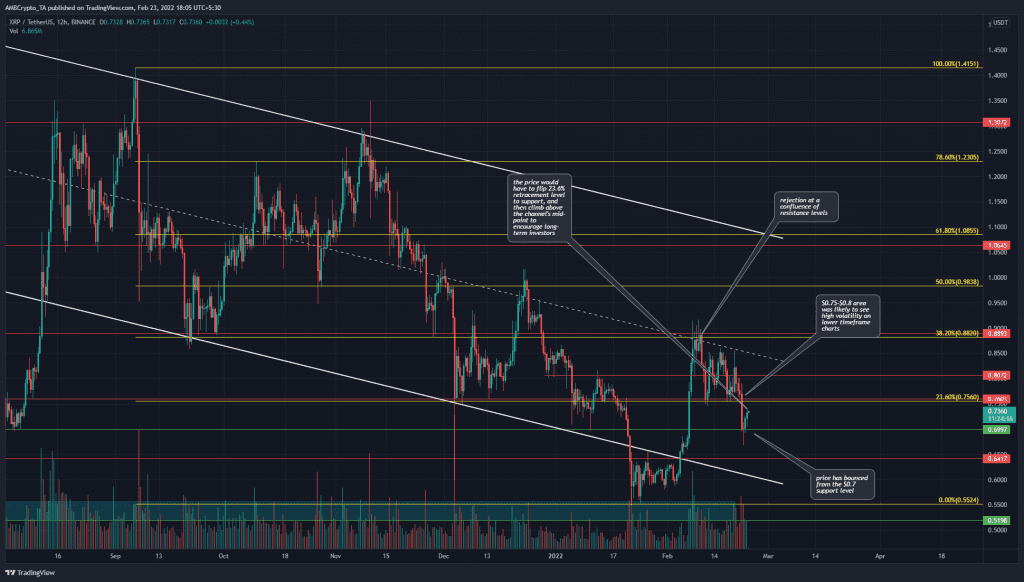
XRP- 12H
In white is a descending channel that the price has traded within since September. In the past few weeks, the mid-point of this channel (dotted white) has opposed the bulls. Moreover, the $0.9 and $0.756 levels were Fibonacci retracement levels that have also acted as resistance and support levels.
XRP fell beneath $0.756, but the $0.69-$0.65 area was a place where demand stemmed in. At the time of writing, XRP was attempting to climb toward $0.756. A move above this level would not assure that XRP could move toward $1. The mid-point of the channel and the $0.9 levels, therefore, are the main levels to watch out for in the weeks to come.
Overall, the trend of the past few months has been bearish, and long time horizon investors would need to wait for this trend to flip before they can consider buying XRP.
Rationale

Source: XRP/USDT on TradingView
On the 12-hour chart, the RSI did not drop too far below 40, and this has been a level that has seen losses follow if the RSI slipped below it. At the time of writing, the momentum was bearish but reverting to neutral due to the bounce from $0.65.
The Awesome Oscillator dived below the zero level once again. While the momentum indicators showed neutral to bearish momentum, the Directional Movement Index showed that a strong trend in either direction was not in progress – the ADX, -DI and +DI lines were clustered at the 20 mark.
The OBV formed higher lows in the past couple of weeks, even as the price formed lower lows- a bullish divergence.
Conclusion
There was some evidence of demand in recent days, but that might not be indicative of a move higher. Flipping the $0.76 level to support could encourage bulls. Moreover, the USDT dominance chart was at 4.5%, down from 4.87% a few days ago. If this chart continued to sink lower, it would indicate tether reserves flowing back into the crypto market- which could spark a slow recovery across the market. Caution was still advisable – BTC could climb to $42k and still not flip its market structure to bullish.
Disclaimer: The findings of this analysis are the sole opinions of the writer and should not be considered investment advice.