Aave, the fifth-largest DeFi protocol according to DefiLlama with a TVL of over $14.02 billion, seems like it is beginning to gather steam. In fact, just yesterday, it jumped by nearly 33% on the back of excellent volumes – suggesting a further run-up may be on the cards.
Major breakout underway
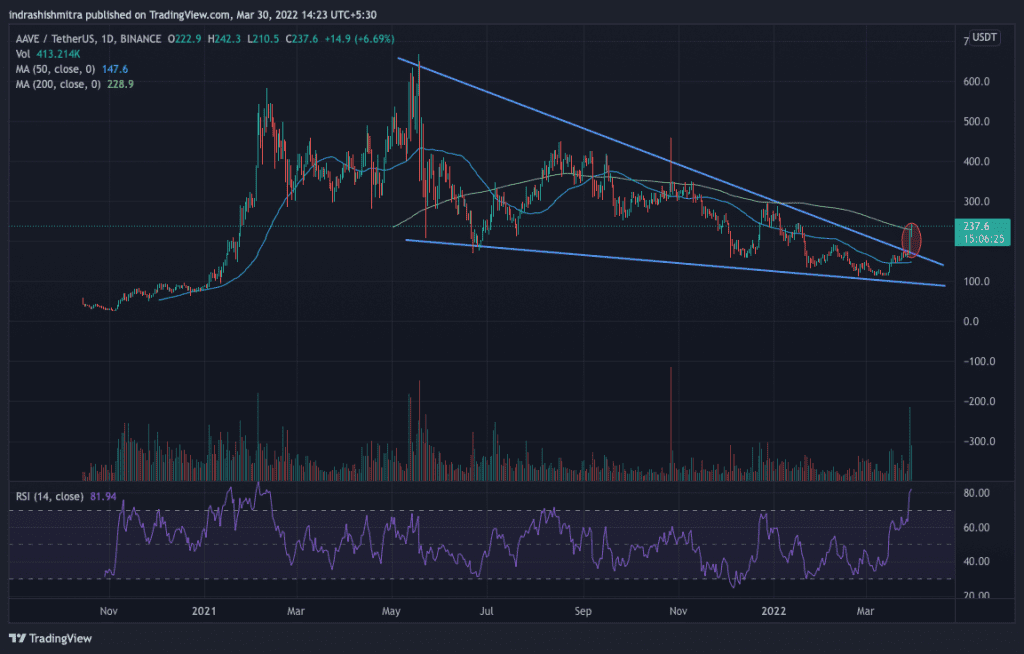
Following yesterday’s 33% intra-day rally, in one fell swoop, AAVE successfully broke out of the descending wedge and the 200 day moving average. The descending wedge’s bullishness was confirmed with the breakout and the breaching of the 200 DMA could also signal a trend reversal in the altcoin in line with the broader cryptocurrency market.
This also marked AAVE’s breakout from a near 12-month trendline resistance.
However, there is a caveat. It had crossed over the 200 DMA several times after July 2021, but wasn’t able to sustain above it. This time too, if it isn’t able to sustain, a recovery might be hard to stage. Additionally, the RSI was found to be over 80 at press time – A sign that overbought levels and some profit booking may be seen first.
However, there are a bunch of other signals that support a bullish view for this altcoin. Data from coinglass.com revealed that there have been a lot of short liquidations. Nearly $2 million worth of shorts were liquidated thanks to the rally.
This can indicate two things – First, the rally was stimulated by heavy short covering. Second, with all these short positions kicked out of the market, the path ahead for the bulls is clearer.

AAVE Total Liquidations | Source: Coinglass.com
Optimistic metrics
On-chain metrics seemed to suggest optimism too, at the time of writing. Supply held by top addresses as a percentage of supply, which had been falling since August 2021, saw a spike since the beginning of March 2022.
This suggests that HODLers with cash to spare are buying into AAVE to bring down their averages – pointing towards a bottoming out of prices on the charts.

Supply held by top addresses (as a % of total supply) | Source: Santiment
Daily active addresses have also seen an uptick of late, reaching its highest point since November last year. This shows that on-chain activity has also been recovering – A good sign for the future of the coin.

Daily Active Addresses | Source: Santiment
In line with the uptick in daily active addresses on the chain, on-chain volumes also jumped up to its highest level since November 2021. A rally supported by volumes is generally accepted as a very bullish sign.

Volumes | Source: Santiment
It is interesting to note that volumes and daily active addresses have never been this high, despite several hikes in price since November 2021. Thus, the likelihood of a bull trap emerging at this point seems very low too.
Short-term positions may see losses due to some profit booking at these high levels. However, if it sustains and is able to break out of the 200 DMA, a proper trend reversal will be underway. The next level of serious resistance would be around $400-$450 and then at the ATH of $667.