The Avalanche(AVAX) price experiences a surge in bullish demand, evident by the jump of 23% in the last two weeks. The recovery rally outgrows the symmetrical triangle pattern giving a bullish breakout. Should you consider buying the breakout?
Key points:
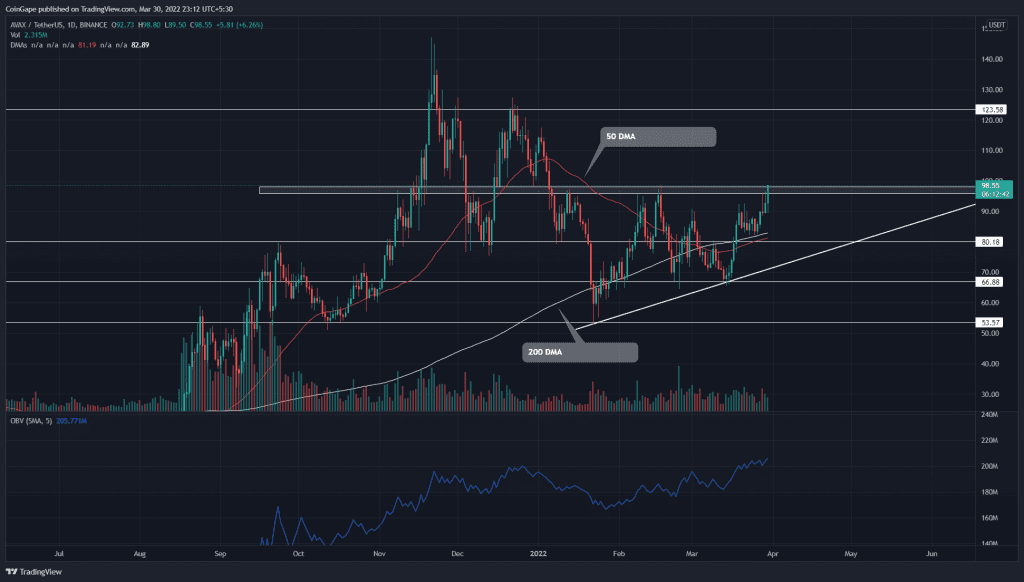
- AVAX chart shows a golden crossover between the 50-and-200 DMA
- The daily-OBV indicator slope is trending high
- The intraday trading volume in the AVAX is $1.3 Billion, indicating a 30.63% gain
 Source- Tradingview
An ascending trendline supports the new higher lows of the AVAX recovery rally. The recent bull cycle from the $66 support surged the altcoin by a 45% high to the $96 mark. Today, the altcoin is up by 6.3%, teasing a bullish breakout from the ascending triangle pattern.
However, the sellers have aggressively defended this level over the past two months, and the buyers need to build strong momentum to breach this resistance. If they succeeded, the buying pressure would accelerate and pump the altcoin to $123 resistance.
Contrary to the bullish thesis, if sellers pull the AVAX price below $96 resistance, the subsequent price rejection would lead to a 20% downturn to the support trendline.
Furthermore, the price action would continue to resonate within the ascending trendline for a few more sessions.
Technical indicator
The recovery rally brings a reversal in the 50-day DMA that may shortly cross above the 200-day DMA resulting in a golden crossover. With the golden crossover, the buyers will sabotage the previous death cross and increase the overall bullish attention.
The OBV indicator slope is rallying with new higher highs and higher lows, suggesting the market participants are eager to complete the bullish pattern.
- Resistance levels- $100, and $125
- Support levels- $78 and $66