Despite being up about 5% on the day, BTC’s price took a beating in the past couple of days. It appears that the bulls are attempting to retake control, although the shot at $47K from earlier today has so far been unsuccessful.
Technical Analysis
By: Edris
Daily timeframe:
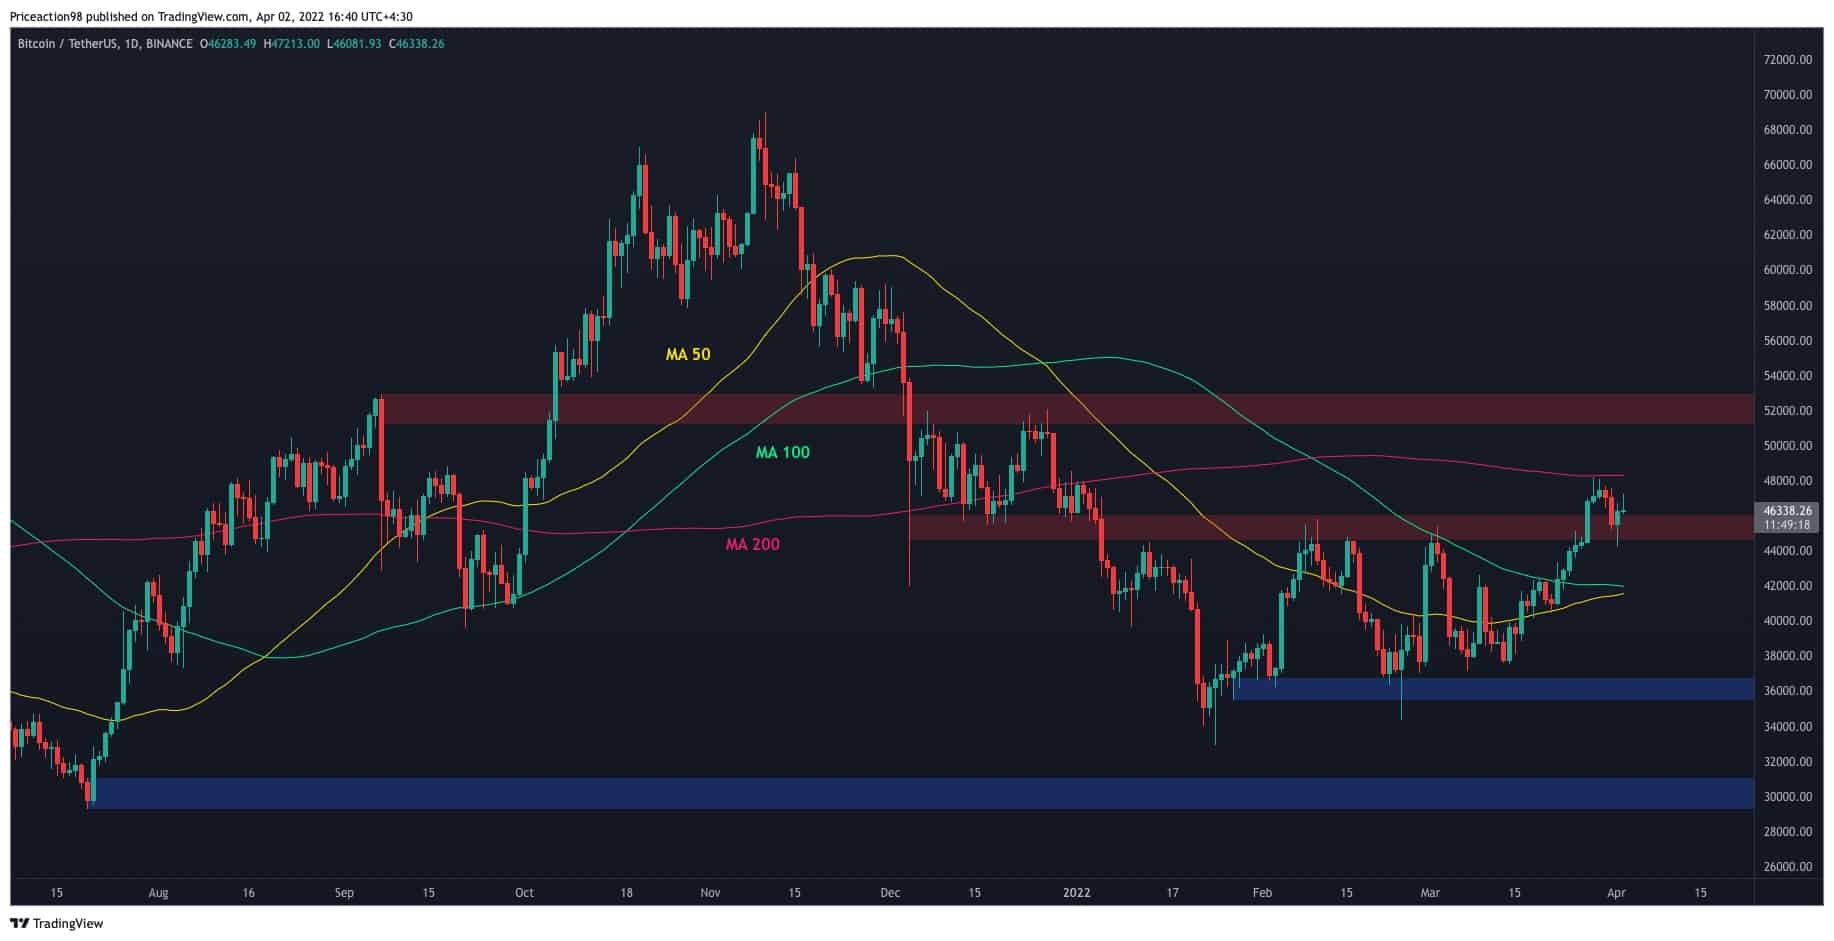
Bitcoin’s price is struggling to recover, and it is still trading below the 200-day moving average. This level is one of the most common indicators to determine whether an asset is in a bull or bear market. The cryptocurrency has been rallying in the past few weeks, and it even broke past the significant $45K resistance zone.
However, the 200-day moving average rejected it to the downside, and the price is currently being held by the $45K broken resistance level, which has now turned into support. If this level fails, a retest of the 50-day and 100-day moving averages would be the first target to the downside. On the other hand, if the price successfully breaks above the 200-day moving average, the $52K level would be the next significant obstacle.
4-hour timeframe:
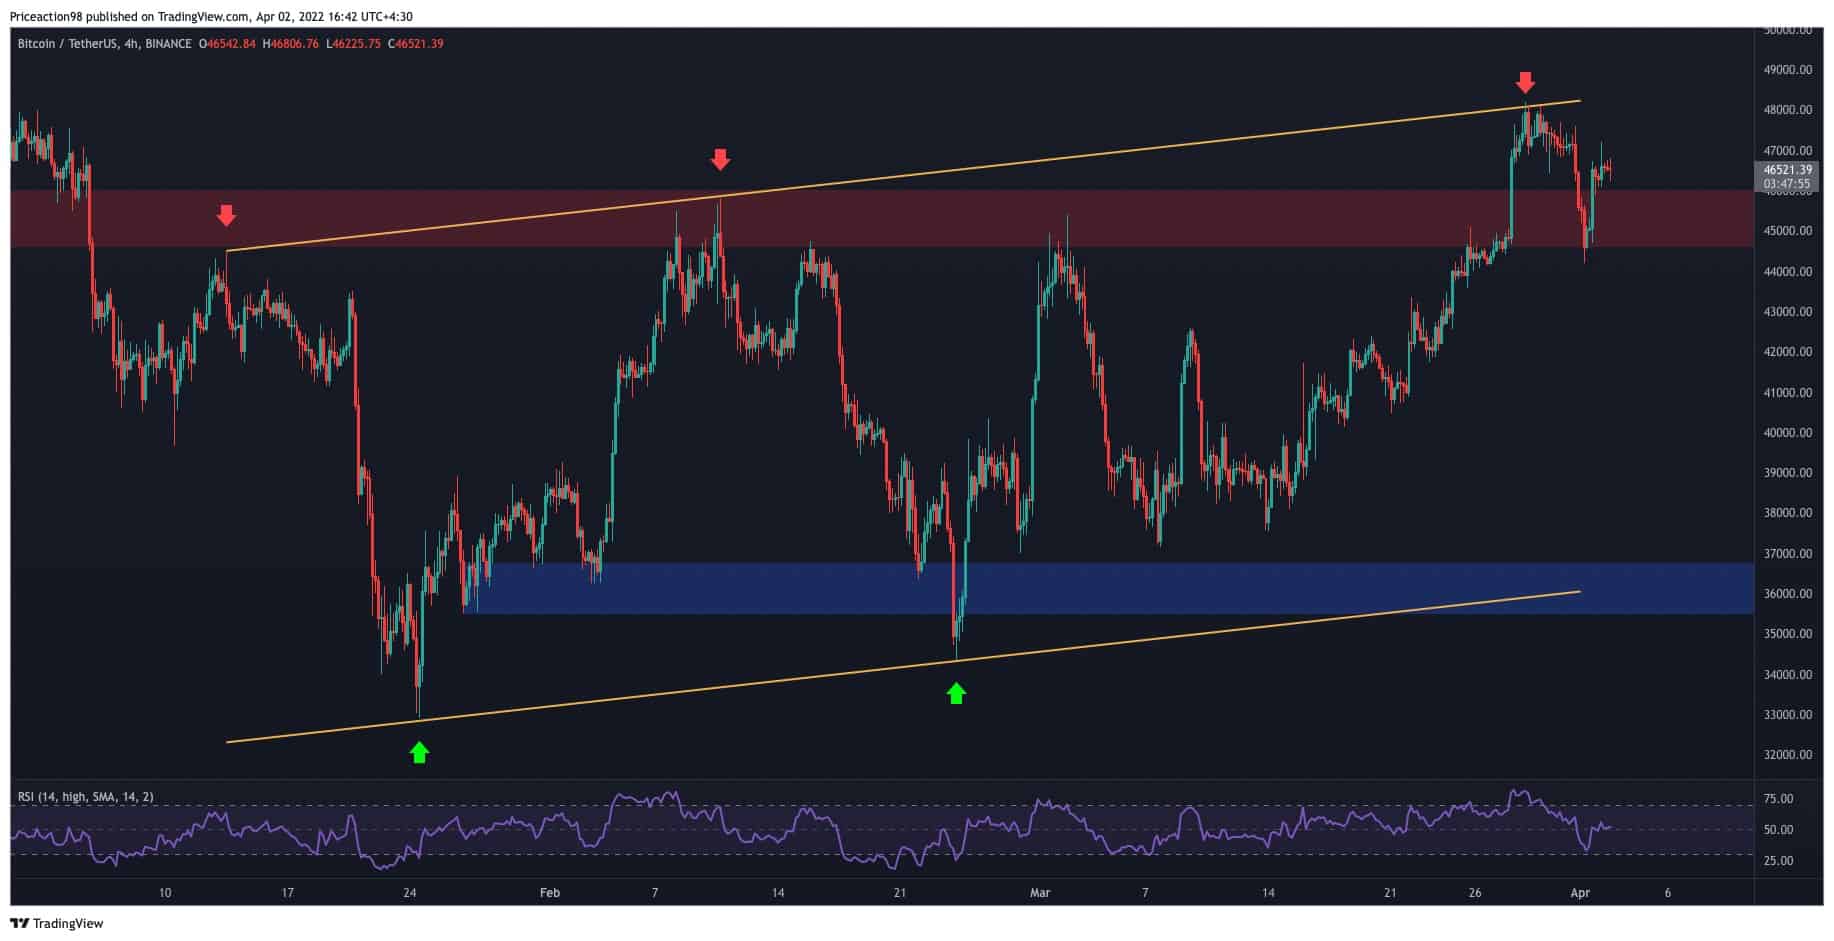
On the 4-hour timeframe, it is evident that the price has been rejected from the top trendline of the large bearish flag pattern as the RSI was massively overbought. BTC has currently rebounded from the $45K level and is in a key range.
If a lower high and bearish trend is about to form, the $46K-$47K area would be a probable turning point. The RSI is also in equilibrium after recovering from a nearly oversold level following the impulsive drop from $48K.
Another bearish scenario would be for the price to form a relatively higher high, with RSI signaling a bearish divergence. Both scenarios would lead to a deeper correction to at least the $36K level and the lower trendline of the flag. A bearish breakout of this pattern would be the worst-case scenario as the price could drop to new lows below $33K. On the other hand, if the price breaks the pattern to the upside, both bearish scenarios would fail, and BTC might continue towards the $52K mark.
Onchain Analysis
By Shayan:
The most pervasive sentiment in international affairs over the last two years has been “uncertainty.” A worldwide pandemic, inflation-related fears, and, most recently, a geopolitical confrontation have all served as triggers for several unstable phases during the last two years.
It is often suggested to zoom out and look at the larger picture during times of uncertainty. The figure below, for example, depicts the bigger picture of Bitcoin’s supply dynamics based on the CryptoQuant data.
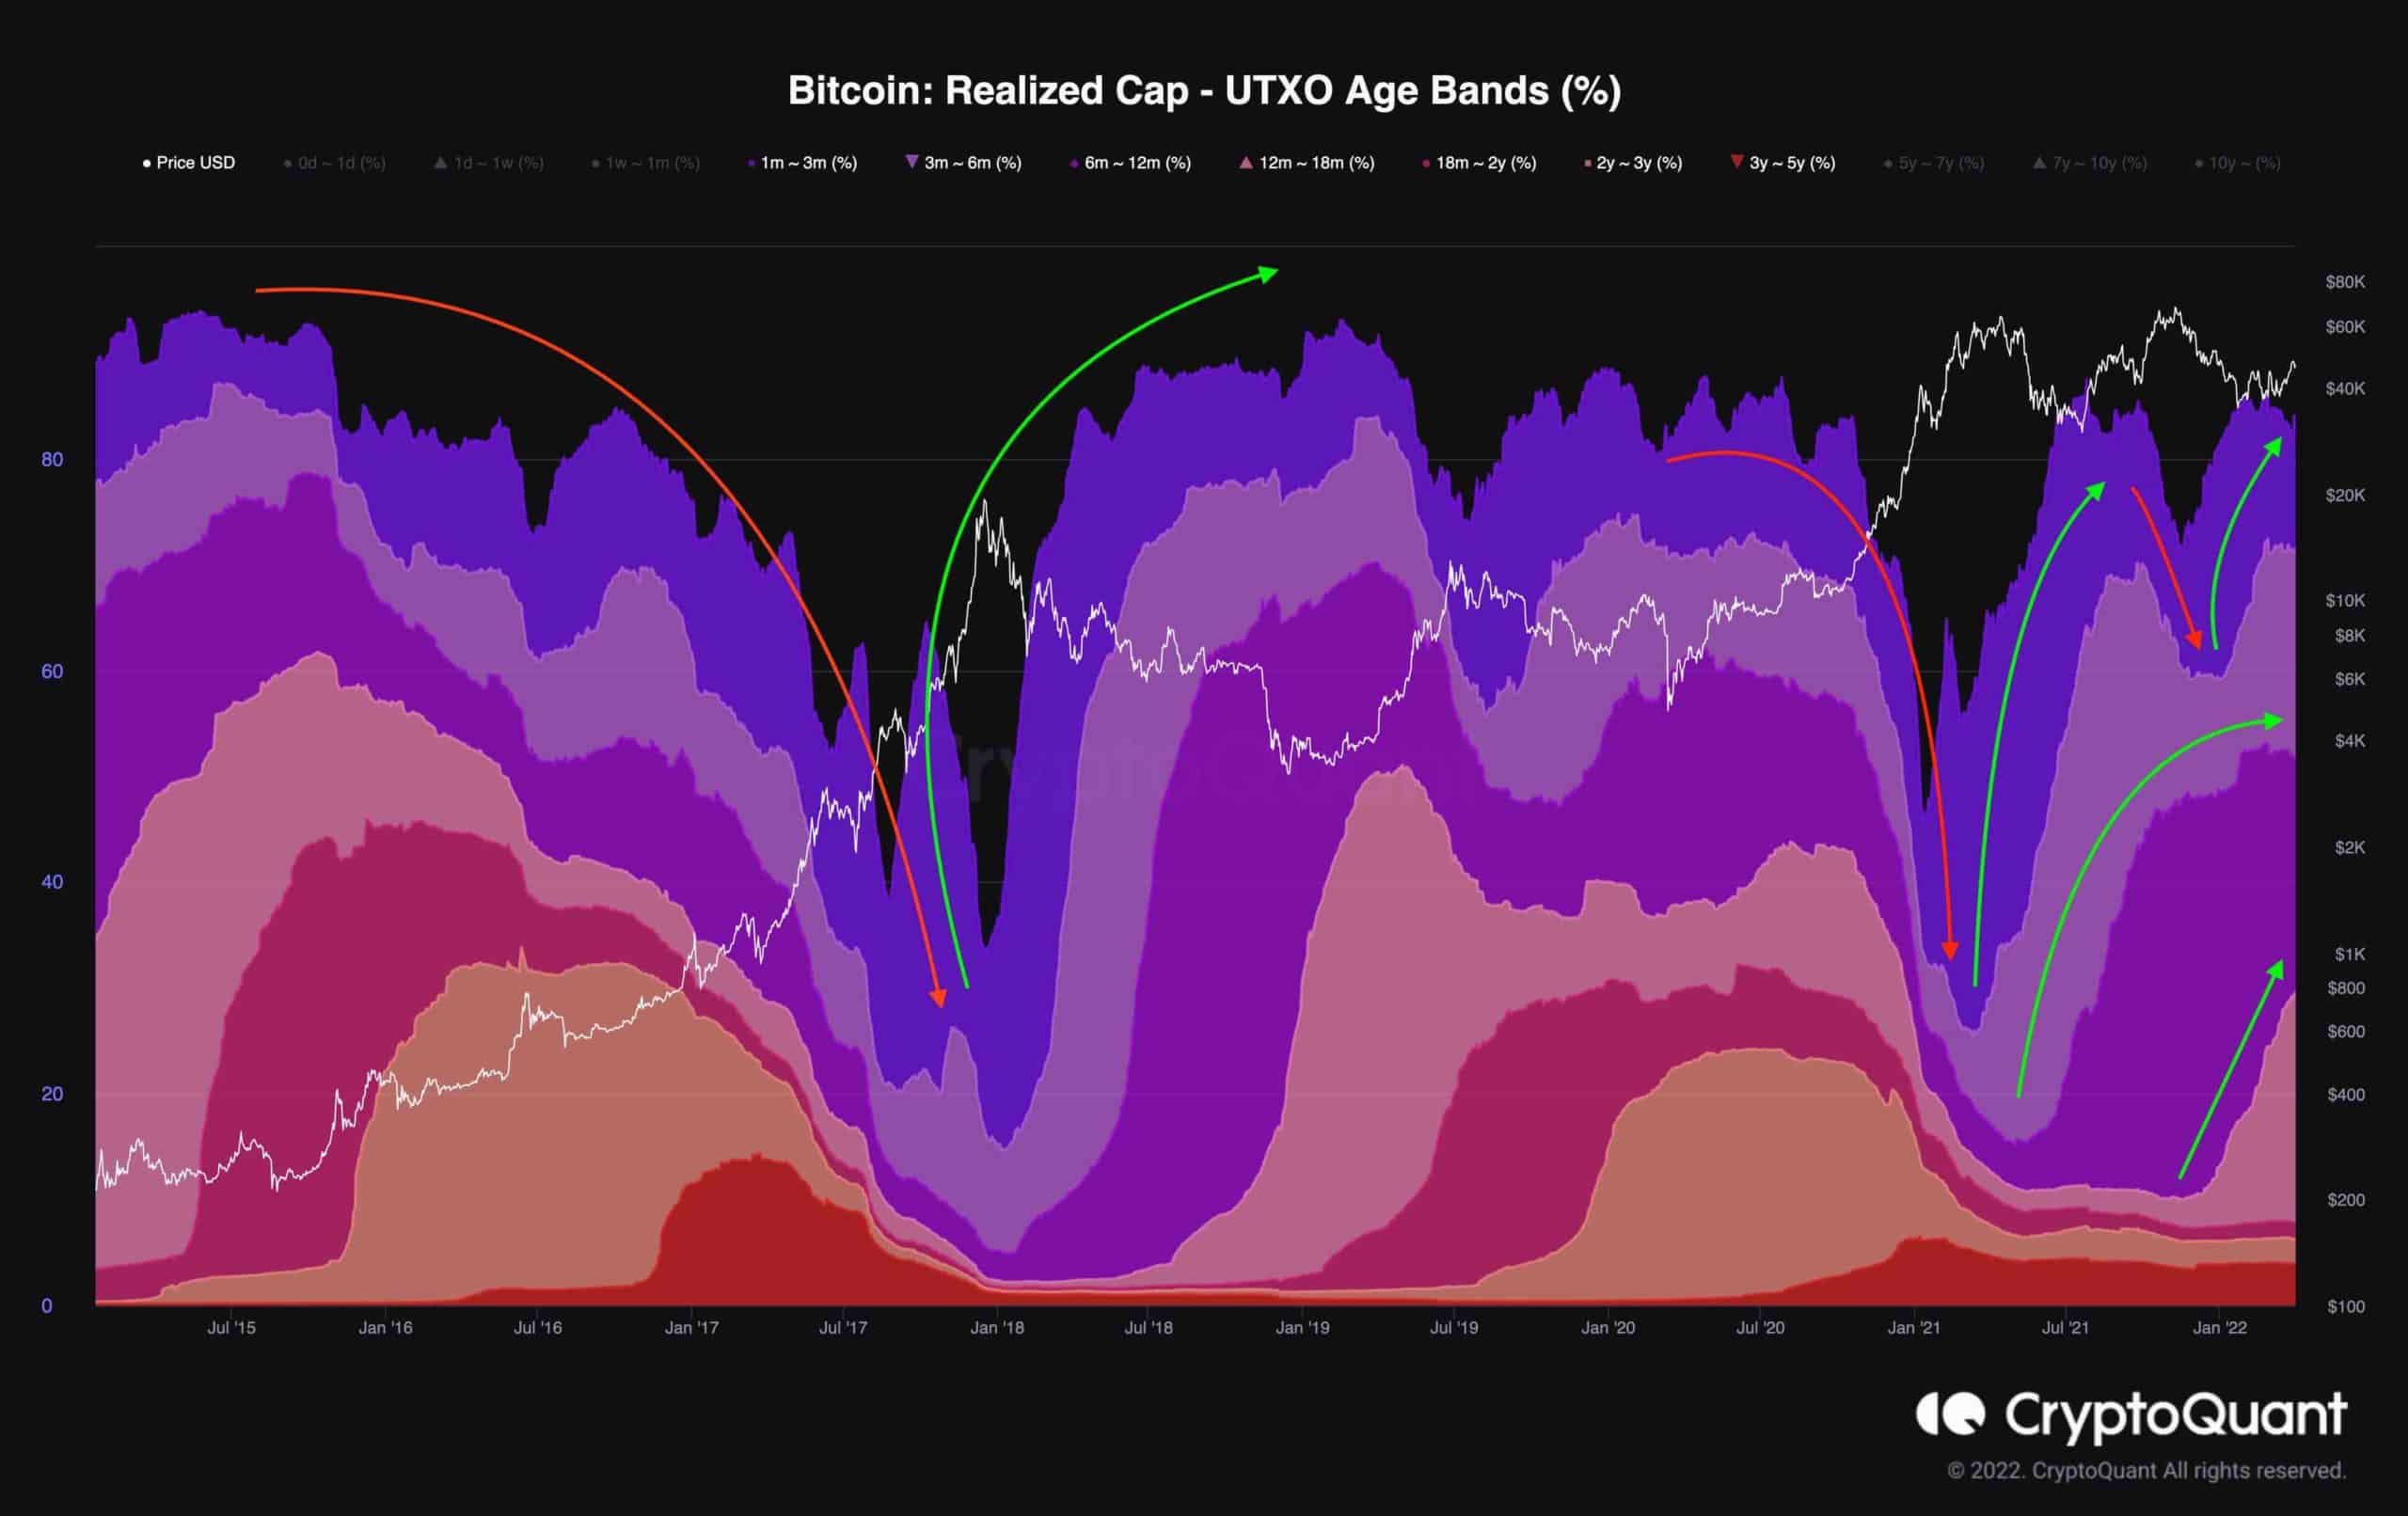
Realized Cap – UTXO Age Bands (%) is a measure that visualizes clusters of coins based on their lifetimes (the last time they were transferred) and their proportion of the overall realized cap. Coins ranging in age from three months to 5 years are displayed and distinguished by various colors, as mentioned in the chart’s narrative.
In summary, an increase in these age bands indicates HODLing and accumulation (green), while a decrease in them indicates selling and distribution (red) among mid to long-term holders.
The market is presently in an accumulation period, with the number of coins that have moved in the previous three months gradually growing.
Binance Free $100 (Exclusive): Use this link to register and receive $100 free and 10% off fees on Binance Futures first month (terms).
PrimeXBT Special Offer: Use this link to register & enter POTATO50 code to receive up to $7,000 on your deposits.
Disclaimer: Information found on CryptoPotato is those of writers quoted. It does not represent the opinions of CryptoPotato on whether to buy, sell, or hold any investments. You are advised to conduct your own research before making any investment decisions. Use provided information at your own risk. See Disclaimer for more information.
Cryptocurrency charts by TradingView.