While the broader market has been picturing some slow signs of recovery, some coins have been going against that trend. XRP, Zilliqa, and Dogecoin seemed ready for a price correction going forward, at press time.
On the contrary, Polkadot seems to be following the general market trend and is making steady progress north.
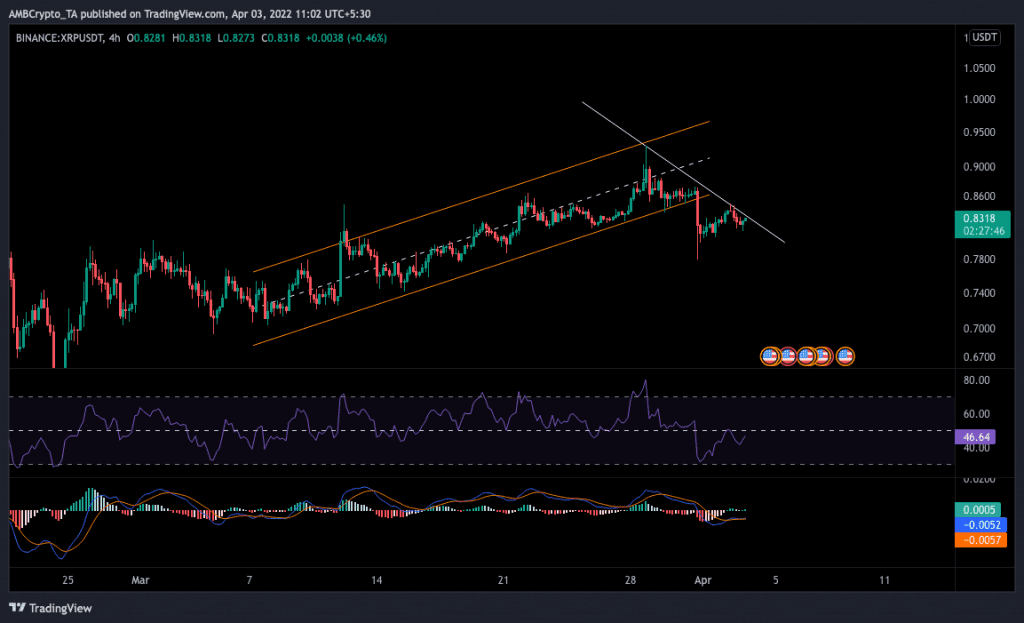
XRP
XRP had been on a broad-based recovery since the beginning of March, but that upward channel was broken with conviction towards the downside on 31 March. This has most likely shattered the dreams of a run towards $1 for the altcoin. The next level of support would possibly land near $0.7 region, a level where XRP had been consolidating towards the latter half of February.
With the Relative Strength Index (RSI) marginally below 50, upward momentum seemed weak but not poor either. Any positive news can help push XRP up through the resistance and break the downtrend that is beginning to form. Even the MACD is giving similar signals, with the MACD line crossing over the signal line but trading in the sub-zero region.
Zilliqa (ZIL)

ZIL/USDT | Source: Tradingview
One of the best performing alts of this season, Zilliqa rallied just shy of 400% in around eight days. But since 1 April, it has started correcting, per usual. After a rally this high, some form of correction is bound to happen to account for profit booking. However, a descending triangle pattern has been forming on the chart, suggesting further bearishness may be on its way till the next support level of $0.1.
The Relative Strength Index (RSI) has also been falling steadily with the dip in prices corresponding with falling On-balance volume (OBV). This confirms the views mentioned above.
Dogecoin (DOGE)

DOGE/USDT | Source: Tradingview
Technically speaking, Dogecoin, on the 4-hour chart, has managed to break out of a long downtrend that began back in November 2021. However, zooming in, despite the breakout towards the end of March, things don’t seem too well either. Prices are currently trading just below the 20 and 50 period SMAs. These are good short to medium term support/resistance levels.
The RSI is barely able to cling on to the 50-mark and Awesome Oscillator has begun showing red bars in the negative territory – further lending weight to the overall bearishness.
Polkadot (DOT)

DOT/USDT | Source: Tradingview
Polkadot has been recovering quite well in terms of prices since the beginning of March. So far, it has recovered nearly 50% in that timeframe and is currently trading just below a resistance level (marked in dark green). Its up move has been slow and steady, unlike Zilliqa’s, so presumably a price correction wouldn’t be as harsh either. Once it is able to cross over the resistance (marked in dark green) ~$23, it can be expected to rally up to the next logical resistance zone of around $29-30.
Even the Supertrend indicator had positive views going ahead, with the last few candles marked with green at press time. The RSI was also close to 60, so there is enough space for an upward move before it reaches overbought territory.