SHIBA price continues to move sideways for the fifth session in a row. The price takes support near the critical 50-day EMA. Traders are advised to wait for a decisive break out of the trading range before taking any aggressive bids.
- SHIB price consolidates with a positive bias on Tuesday.
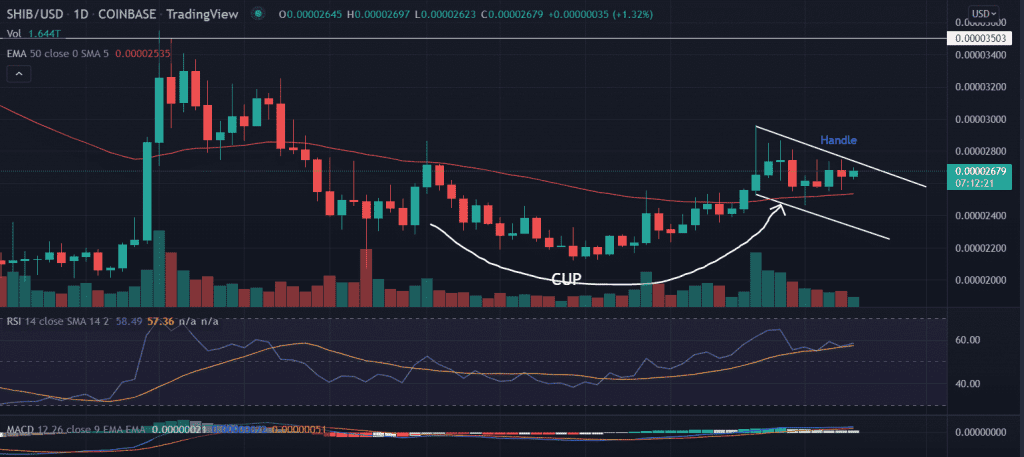
- A bullish formation on the daily chart indicates impending bullish momentum.
- The downside is capped near the 50-day EMA at $0.000025.
As of press time, SHIB/USD trades at $0.000026, up 0.49% for the day. The 24-hour trading volume of the token holds at $836,767,112 with a loss of 24% as per the CoinMarketcap.
SHIB price trades sideways
On the daily chart, SHIB’s price consolidates below $0.000028 for the past few sessions. The price has formed a bullish reversal formation ‘ cup and handle’. The asset found relaible support around $0.20, while the price retraced from the highs of $0.000029.
The probability of a fall below the 50-day ema (exponential moving average) looks less optimistic. The formation of multiple ‘doji’ candlesticks suggest sellers are exhausted near the moving average.
Now a decisve break of the upper trendlien of the formation will meet two immeidate upside targets at $0.000028 and $0.000030.
Furthermore, the $0.000030 mark remains a crucial level to trade. An extended buying could push the price toward the ultimate target of $0.000035.
On the flip side, a spike in sell orders could disapprove of the bullish outlook on the asset. In that case, a fall below the 50-day EMA at $0.000025 could meet the horizontal support level at $0.000020.
Technical indicators:
RSI: The daily Relative Strength Index oscillates above the average line with a neutral bias. Any uptick in the indicator would advocates for the bullish bias.
MACD: The Moving Average Convergence Divergence trades above the mid-line.