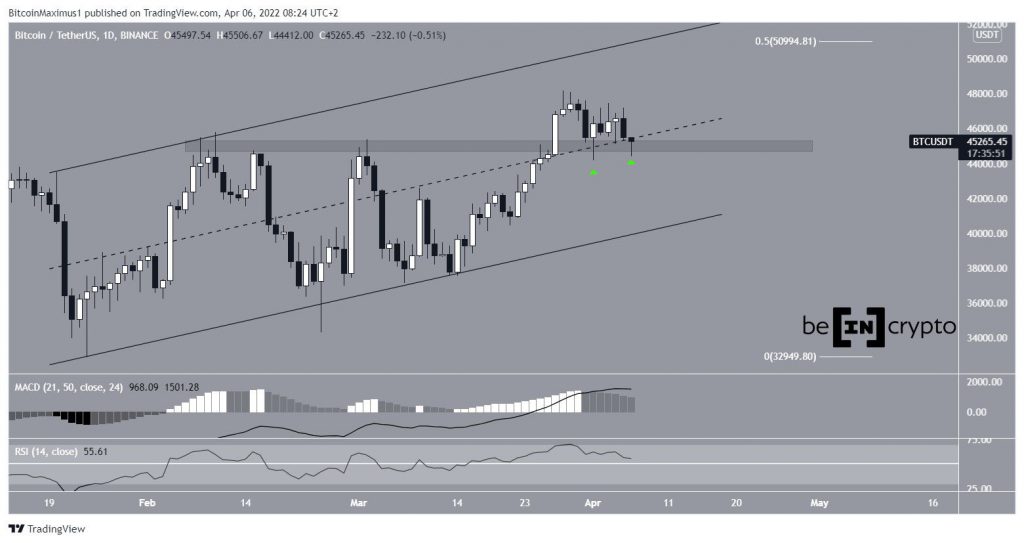
Bitcoin has been moving upwards since Jan. 24. It’s possible that the increase is contained inside an ascending parallel channel. BTC bounced at the support line on March 14 and began to accelerate.
On March 27, Bitcoin broke out above the $44,800 area and the midline of the channel. It then returned to validate this area as support on April 1 and 6 (green icons). While the latter daily candlestick has yet to close, it’s in the process of creating a long lower wick, which is considered a sign of buying pressure.
The next closest resistance is found at $51,000. This is the 0.5 Fib retracement resistance level and coincides with the resistance line of the channel. While both the RSI and MACD are falling, they are still in positive territory.
Short-term resistance
The two-hour chart shows that BTC has been trading underneath a descending resistance line since March 28. So far, it has made six attempts at breaking out (red icons), all unsuccessful. The most recent rejection occurred on April 6 and caused the downward move to reach a low of $44,412 the same day.
However, BTC bounced at the $44,550 minor support area and created a very long lower wick. This was the second time this area offered support (green icons).

BTC wave count analysis
The most likely long-term wave count indicates that BTC is in wave C of an A-B-C structure (black).
The most likely top for this structure is found near $50,700. This target is found by giving waves A and C a 1:1 ratio (black) and the 1.61 external retracement of sub-wave four (white).
The sub-wave count is shown in white.

There are several possibilities for the short-term count. The most likely one suggests that BTC is still in sub-wave four, which has taken the shape of a symmetrical triangle.
After the triangle pattern is complete, a breakout towards $50,700 would be expected.

The second possibility would suggest that BTC has begun the fifth and final sub-wave.
The issue with this count is the length of the second minor sub-wave (red), which is actually bigger than the second sub-wave (white).
If this were the correct count, bitcoin would be expected to reach a high closer to $54,000.

The final possibility suggests that BTC has just completed sub-wave four inside a running correction.
The end result of this scenario would be virtually the same as that of the triangle pattern wave count.

Bearish alternatives
The main bearish alternative indicates that wave C is complete. However, BTC is currently retesting both the horizontal and diagonal previous breakout levels (green icons).
Therefore, as long as it’s trading above these levels, this count remains unlikely.

Also, the short-term movement does not fit with this bearish alternative. The reason for this is that the decrease following the March 28 high is a three-wave structure, instead of a five-wave one, as would be expected if this were a bearish trend reversal.

For BeInCrypto’s previous Bitcoin (BTC) analysis, click here
Disclaimer
All the information contained on our website is published in good faith and for general information purposes only. Any action the reader takes upon the information found on our website is strictly at their own risk.