Bitcoin’s price entered a correction zone after peaking above $48,000 towards the end of March. This was an inevitable pullback considering its strong price action from around 22 March which temporarily pushed it below $45,000.
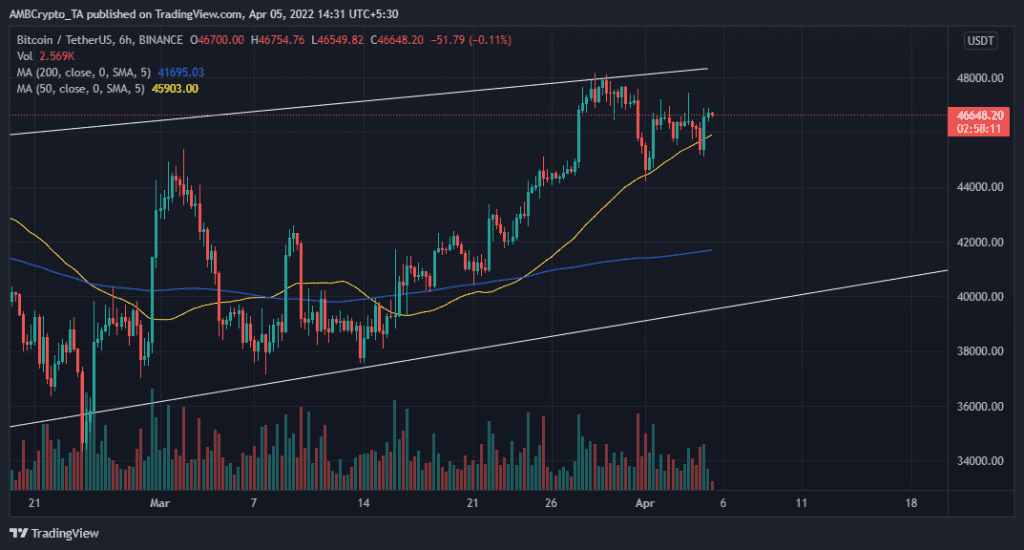
BTC has since enjoyed some recovery and traded at $46,630 on 5 April, after a 0.82% rally in the past 24 hours. A look at its 6-hour chart reveals that it was trading within an ascending support-and resistance zone since January this year. The pullbacks observed in the last few days have also registered strong recoveries, a sign that many wallets are holding on to their Bitcoin.
It’s worthy to note that BTC’s latest uptick has pushed it back above its 50-day moving average. Moreover, its RSI is also back above its mid-level. Thereby, confirming that BTC is still experiencing significant buying pressure.
Will Bitcoin yield to bears?
Bitcoin’s current price level is in a zone of uncertainty, and perhaps evaluating some of its on-chain metrics may help provide a clearer picture of where it is headed next. The cryptocurrency’s latest rally which kicked off around mid-March happened after a supply shock that was characterized by exchange outflows.

Source: Glassnode
Bitcoin’s circulating supply relative to the balance on all exchanges (supply shock metric) declined from mid-February to the start of March when it started rallying. Meanwhile, Bitcoin’s price experienced a significant rally from 23 February, leading to a divergence between the supply shock metric and the price. The price consequently yielded to the downside up until 13 March.
The uptrend in the supply shock metric highlights strong exchange outflows from early March up to now. The price registered a positive correlation through an uptick from 7-9 March before another correction that yielded a bullish supply shock. This is the same supply shock that aided the rally from mid to end of March.
Bitcoin’s exchange net position change indicator shows that there have been more outflows than inflows. However, it currently highlights an increase in the last two days. Furthermore, the supply relative to exchange balances hints at the lack of strong selling pressure and reflects the strong support in BTC’s price action.