Over the last two weeks, the Sandbox(SAND) price formed a short consolidation zone, stretching from $3.64 to $3.32. Amid the uncertainty in the crypto market, the sellers took the major lead and dumped the altcoin below the range support. Losing this local support, the sellers tend to sink the coin back to the $2.68 support.
Key points:
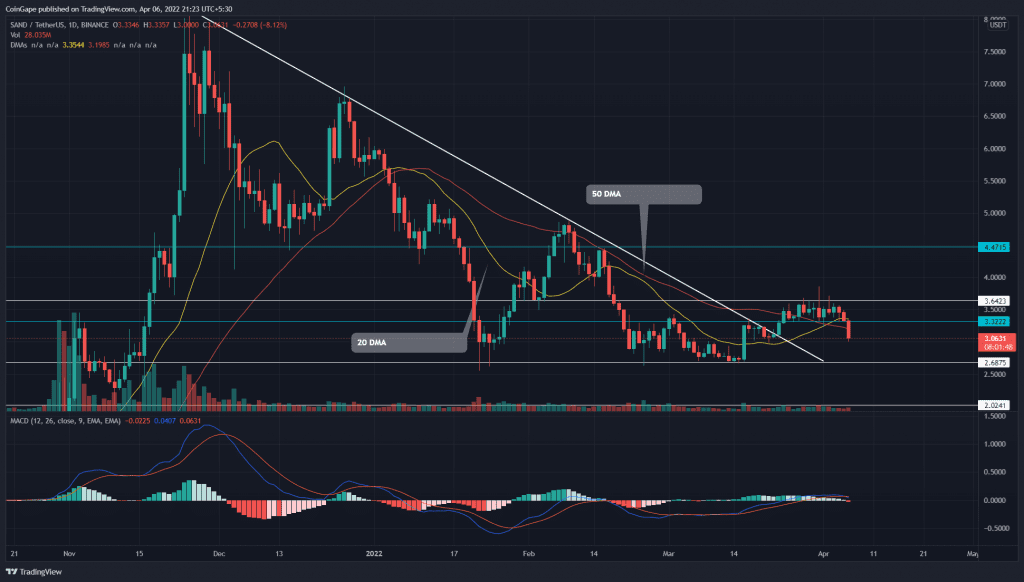
- SAND buyers lost the 20-and-50 DMA support.
- The MACD indicator triggers a bearish crossover
- The intraday trading volume in SAND price is $719 Million, indicating a 33.46% loss.
 Source- Tradingview
The SAND/USDT technical chart revealed a strong bullish step-up when the price breached a long-coming descending trendline on March 23rd. The recovery rally surged to the immediate resistance at $3.6, indicating a 34.5% gain from the $2.86 bottom support.
However, the sellers mounted a strong barrier at the overhead resistance and restricted any further rally. Furthermore, bearish divergence on the daily-RSI chart accentuated the bulls getting exhausted, which resulted in a $3.32 support breakdown.
Today, the SAND price is down by 10.3% and shows a massive fallout from the range support. If the coin price provides enough sustainability below the breached support, the sellers will pull the price 9% down to $2.68 support.
Anyhow, the $2.68 mark stands as a strong foothold for SAND buyers as it sustained the three sell-offs during the last quarter.
Technical analysis
The MACD indicator gives a bearish between the fast and slow, indicating a sell signal to the SAND traders. Moreover, these lines may soon nosedive below the neutral zone, providing additional confirmation.
The 20 DMA dynamic support assists buyers in maintaining strong support at the $3.38 mark. However, today’s price dip pierced the 20 and 50 DMA support, encouraging more selling in the market.
- Resistance levels- $3.4 and $3
- Support levels- $2.68 and $2