After the April 6 decrease, Bitcoin (BTC) bounced at a confluence of support levels but has not yet shown any decisive bullish reversal signs.
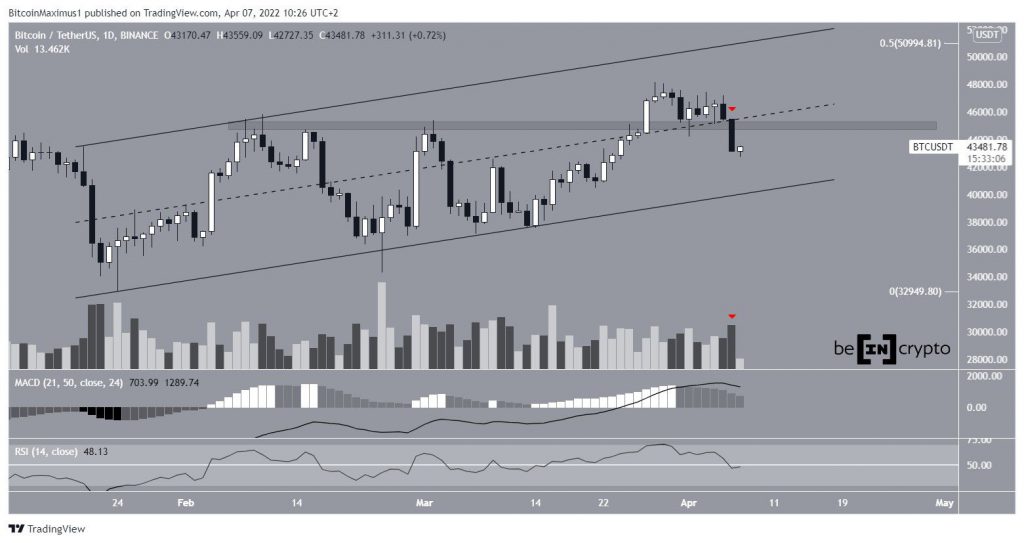
Bitcoin has been falling since reaching a local high of $48,189 on March 28. Initially, the price bounced above the $44,800 area, seemingly validating it as support (green icon). The area had previously acted as resistance between Feb. 8 and March 27.
However, BTC broke down amid a large bearish candlestick on April 6 and reached a low of $42,727 the next day.
The decrease did not occur with significant volume (red icon) and the MACD and RSI are still positive. Nevertheless, the $44,800 area is now expected to act as resistance.
In the daily time frame, the closest support area is found at $40,400. This target coincides with an ascending support line that has been in place since Jan 24.
Can BTC reclaim the $44,800 area?
The six-hour chart shows that BTC has been trading inside a descending parallel channel since March 28. Such channels usually contain corrective movements, meaning that an eventual breakout from it would be expected.
BTC bounced at the support line of the channel on April 7 and initiated the current upward move. The bounce also occurred at a confluence of support levels near $42,900, created by the 0.5 Fib retracement support level and a horizontal support area.
However, apart from the oversold RSI (green icon), there are no bullish reversal signs in place.

The two-hour chart paints a similar picture and shows that the RSI has not been this oversold since the Jan. 24 bottom (green circle).

Wave count analysis
Currently, it’s still possible that the entire decrease is a completed wave four, after which BTC will initiate another upward move towards $50,700. The reason for this is the previously outlined channel and the fact that sub-wave A and C have a nearly 1:1 ratio.
A continued decrease would invalidate this scenario.

In that case, it would mean that BTC has already completed an A-B-C structure (black) and will now decrease below $40,000.
Therefore, whether or not BTC is able to rebound at the current level is crucial in order to determine the direction of the longer-term trend.

For BeInCrypto’s previous Bitcoin (BTC) analysis, click here
Disclaimer
All the information contained on our website is published in good faith and for general information purposes only. Any action the reader takes upon the information found on our website is strictly at their own risk.