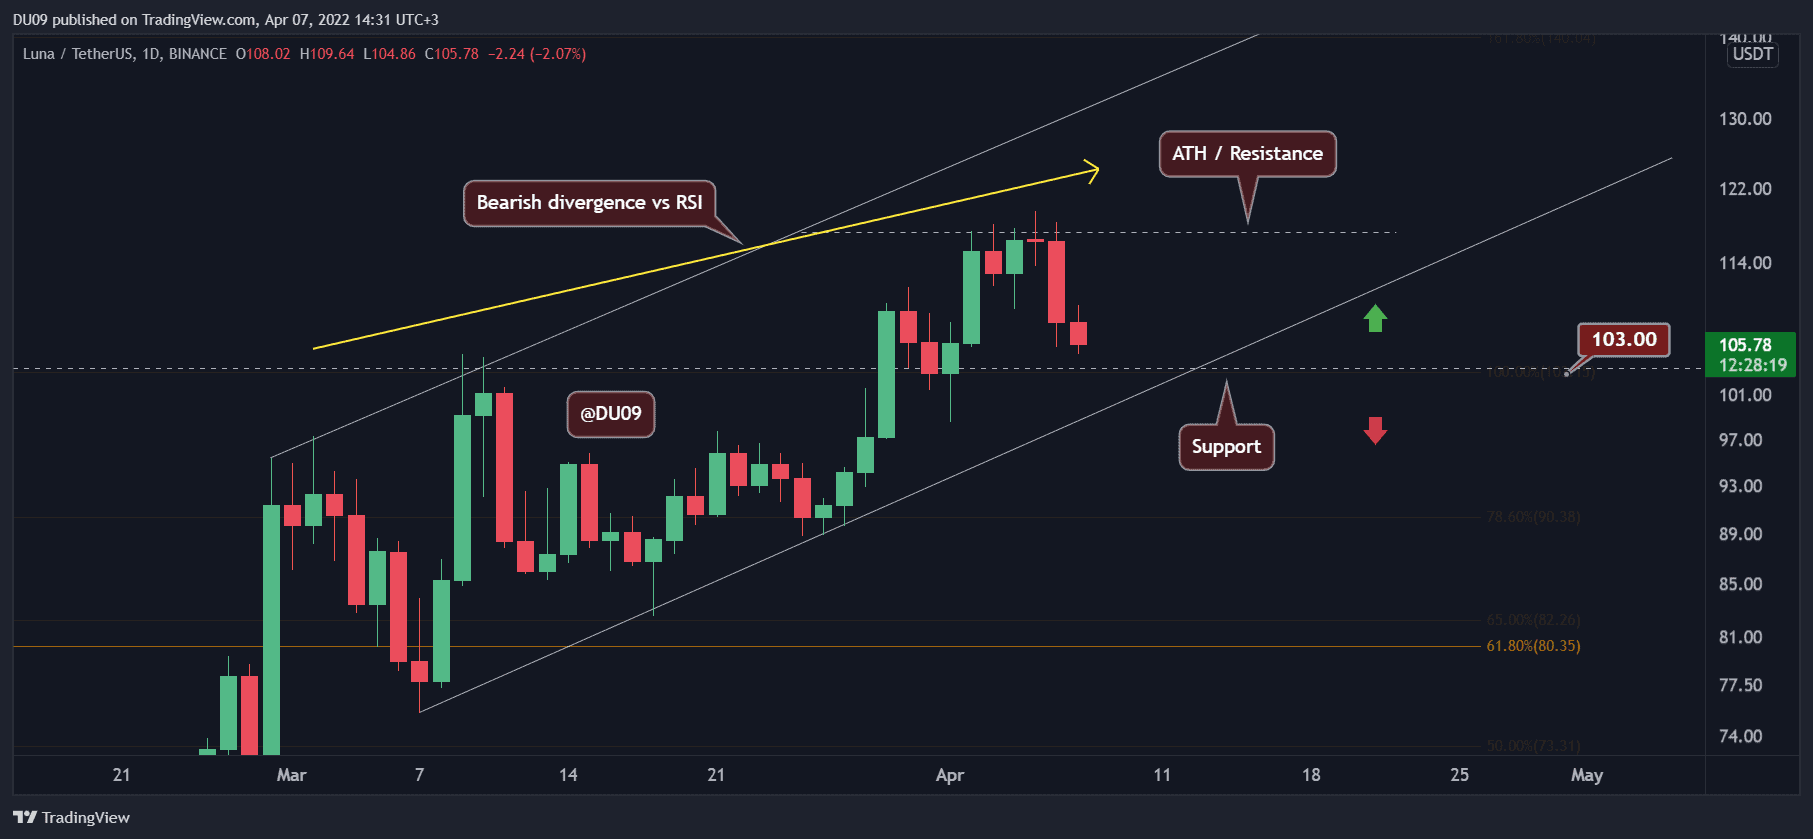
Key Support level: $103, $90
Key Resistance level: $120
After an impressive rally, LUNA managed to set a new all-time high at $119.55 (Binance). The price is now found in a correction after bears took over the market yesterday. This has turned the $120 into resistance, and the next key support level will be found at $103 and $90.
Technical Indicators
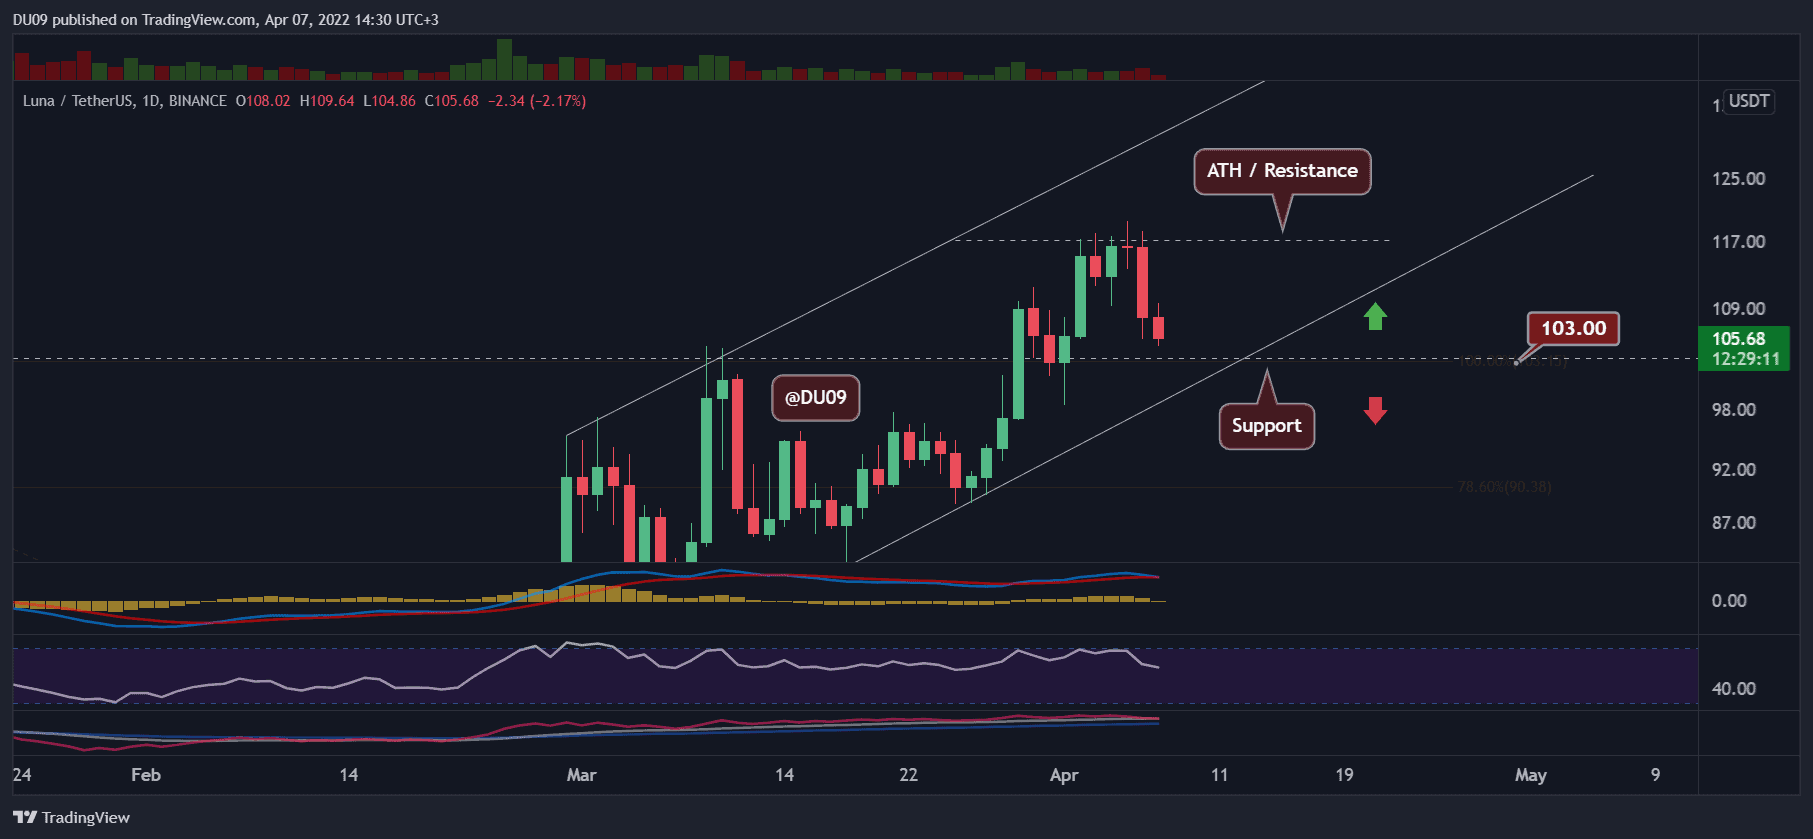
Trading Volume: The volume for Luna remains constant and sustained. The only problem is that this volume has turned into a seller’s market in the past three days – closing in the red.
RSI: The RSI did not reach the overbought levels during this last rally and has made a large bearish divergence on the daily chart compared to the rally in early March. This may signal that a more significant correction is starting.
MACD: The daily MACD is dangerously close to a bearish cross. If confirmed, it would be important to remain cautious.
Bias
The current bias on Luna is bearish based on the indicators and the latest price action.
Short-Term Prediction for Luna Price
Luna has formed a large bearish divergence on the RSI, and with the MACD about to turn as well, it is very hard to expect the price to move above $120 in the near term.
Binance Free $100 (Exclusive): Use this link to register and receive $100 free and 10% off fees on Binance Futures first month (terms).
PrimeXBT Special Offer: Use this link to register & enter POTATO50 code to receive up to $7,000 on your deposits.
Disclaimer: Information found on CryptoPotato is those of writers quoted. It does not represent the opinions of CryptoPotato on whether to buy, sell, or hold any investments. You are advised to conduct your own research before making any investment decisions. Use provided information at your own risk. See Disclaimer for more information.
Cryptocurrency charts by TradingView.