LUNA price extends the previous session’s decline and trades with a negative bias. The price shows signs of moving further lower if sliced the vital trend line. The development could lead to a further crash if LUNA buyers fail to defend key levels.
- LUNA price edges lower with significant losses on Thursday.
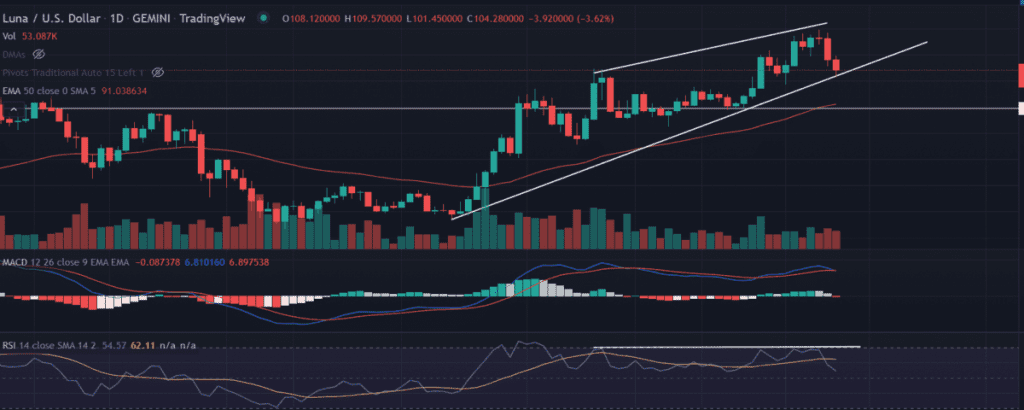
- Expect more downside as RSI gives negative divergence in accordance with the price.
- The price tests the ascending trend line near $101.
As of press time, LUNA/USD exchanges hands at $114.03, down 3.24% for the day. The sixth-largest cryptocurrency holds a 24-hour trading volume of $3,443,266,358 according to the CoinMarketCap.
LUNA price hints at a bearish setup
On the daily chart, the LUNA price tested the ascending trend line, which is extending from the lows of $47.34. It would be interesting to watch if the price is able to hold the level as it could be a significant move.
On the opposite side, intense selling pressure could push the price to break the bullish slopping line. In that case, the LUNA price would meet the horizontal support level at $90.0.
advertisement
On the flip side, a daily close above the session’s high would invalidate the bearish outlook on the asset. On moving higher, the first upside target could be located at record highs of $119.49 made Tuesday.
Furthermore, sustained buying pressure would crave the path to set new record highs around $120.
Technical indicators:
RSI: The daily Relative Strength Index gives a bearish divergence since March 9. However, the price tested all-time highs. Any downtick in the indicator would advocate for further selling in the token.
MACD: The Moving Average Convergence Divergence indicates impending bearish momentum. Although trades above the midline but the moving averages converge with negative sentiment.