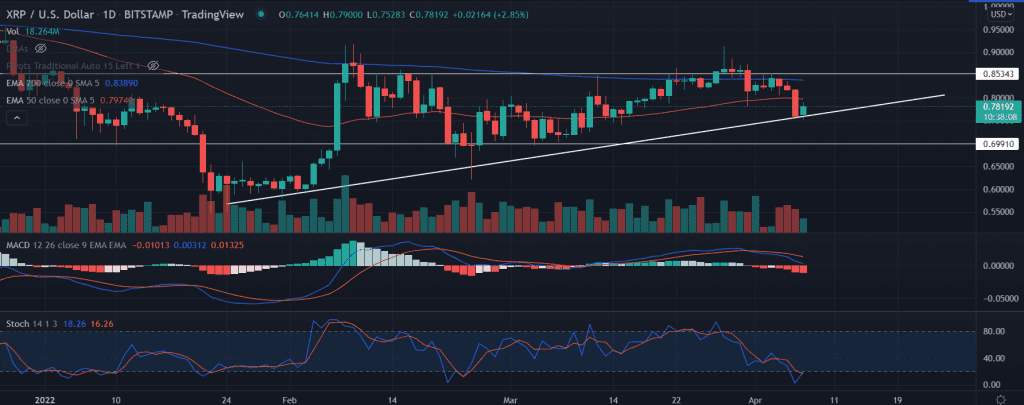
XRP price edges higher after a three-day sell-off. The price uptrend remains steady since January 24, however, a ‘double top’ formation near $0.91 weighed on bullish sentiments. XRP breaches critical moving averages, hinting at a bearish outlook.
- XRP price manages to trade higher on Thursday.
- The price took support near the bullish slopping line a key point for quick recovery.
- XRP remains depressed below the 200-day EMA and 50-day EMA.
As of press time, XRP/USD trades at $0.78, up 2.93% for the day. The 24-hour trading volume of the eight-largest cryptocurrency by the market contains $2,452,273,767 as per the CoinMarketCap.
XRP price steadies before the next action
XRP price tested the critical support near $0.75 after tagging the swing highs of $0.91. This also coincides with the ‘double top’ pattern, which resulted in the current price retracement. Furthermore, the slippage below the 200-day and 50-day EMAs (Exponential Moving Average) at $0.83 and $0.79 respectively makes bears hopeful.
The XRP buyers test the ascending trend line multiple times, which is extending from the lows of $0.54. Earlier, the price witnessed an ascent of nearly 50% from the lows of $0.61. This time too, the bulls would be ready for another run-up with the same figure in mind.
However, moving higher XRP price would face the first upside hurdle at $0.81 followed by the horizontal resistance level at $0.85.
A sustained buying pressure and an acceptance above $0.90 could push the price beyond the $1.0 mark in a highly optimistic scenario.
On the flip side, a break of the mentioned trend line would invalidate the bullish outlook on the asset. In this case, the sellers would keep their eyes on the horizontal support level at $0.70.
Technical indicators:
Stochastic Oscillator: The range-bound indicator remains in the oversold zone, making an attempt to move higher. Any uptick in the indicator is a bullish sign.
MACD: The Moving Average Convergence Divergence retreating below the central line.