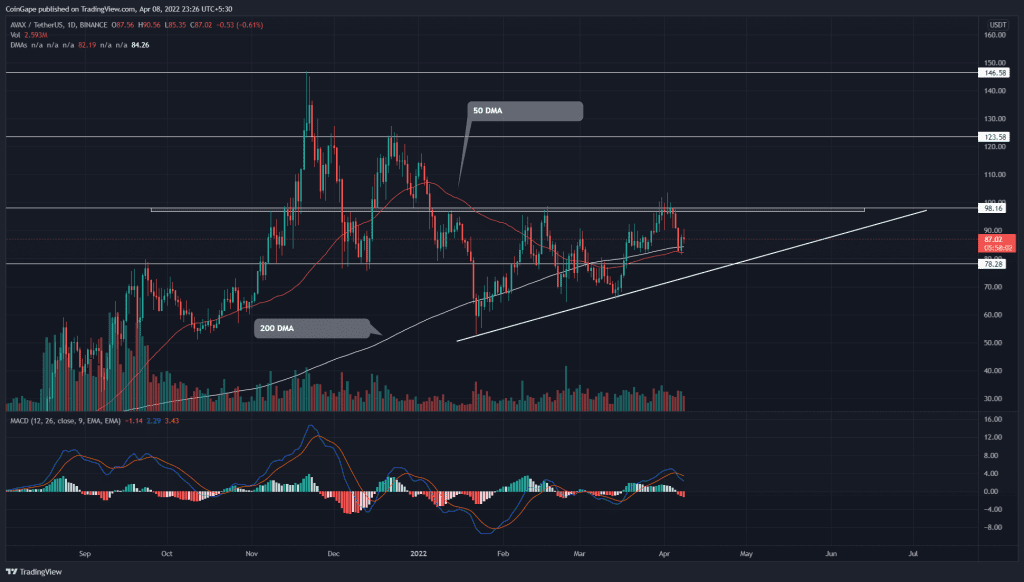
The current bear cycle from the $100 resistance tumbled the Avalanche(AVAX) price by 16%. The altcoin hit the combined support of 50-and-200 DMA, preventing further losses for the coin holder. However, the trades actively respond to an ascending triangle pattern, indicating that the price is likely to bounce back from the support trendline.
Key points:
- The 100 and 200 DMA give a strong foothold for AVAX price
- The intraday trading volume in the AVAX is $1.47 Billion, indicating a 14.14% gain
 Source- Tradingview
The AVAX/USDT pair forms an ascending triangle pattern in the daily time frame. On March 16th, the coin price witnessed a strong inflow and rebounded from the upcoming support trendline. As a result, the bull cycle surpassed the $78 resistance and 200 DMA as it surged 45% to $98.5.
However, the aggressive sellers defended this resistance and did not allow a candle to close above the $100 mark. Later the altcoin turned down from this resistance and slumped 15% to shared support of 50 and 200 DMA.
The AVAX price jumps 10% from this support within a fortnight, hoping to rechallenge the $98.5 resistance.
This bullish continuation pattern highlights the assumption phase within the AVAX chart. Therefore, the traders must wait for an upside breakout and candle closing above the $100 resistance to confirm a genuine rally.
Furthermore, these traders can maintain a bullish tendency until the support trendline is intact.
Technical indicator
The slight upside incline to the 50-and-200 DMA shares a bullish bias for AVAX. These Ema’s support could reinforce buyers to breach the overhead resistance.
However, the bearish crossover between the MACD and signal line attracts more sellers in the market. This sell signal could encourage sellers to extend the bear cycle to bottom support levels.
- Resistance levels- $100, and $125
- Support levels- $78 and $66