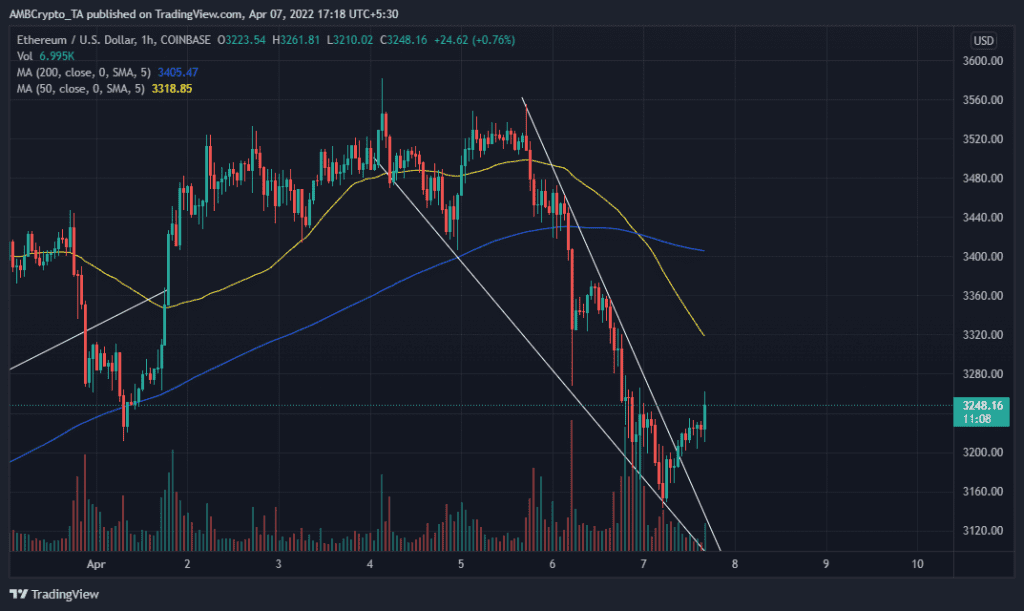
ETH recently entered a correction phase and has been trading within a descending wedge pattern for the last 2 days. However, it managed to break through its descending support line in the early morning hours in the 1-hour chart.
Ethereum recently peaked at $3581 after a strong bull run that kicked off in mid-March, allowing it to rally from sub-$2,600 price levels. It has since then registered a significant price correction and traded at $3,250 at the time of this press. Its 1-hour chart reveals that the price correction has been restricted within descending support and resistance lines forming a wedge pattern for the last 2 days.
ETH managed t break above the descending resistance in the morning, courtesy of bullish momentum that took over from the day’s low at $3,143. If the price action in the 1-day chart is still in the correction phase, the price should experience resistance at the $3,270 price level which is a previously tested support zone.
The $3,300 price level is also a good candidate for a reversal because it aligns with the 0.27 Fibonacci level from the day’s high to the day’s low. Further correction towards the bottom might place the next bullish retracement near the $3,000 price level which has historically been a support and resistance zone.
What can ETH’s technical indicators tell us about its price direction?
ETH’s 1-hour and 1-day charts reveal that the price correction kicked off after the RSI and MFI reached oversold conditions. However, the bullish retracement currently taking place reveals that it was oversold on the 1-hour chart but bounced back after hitting the RSI’s mid level (50) on the 1-day char
The MFI on the 1-day chart was still above 50 at the time of this press while registering inflows on the 1-day chart, a sign that it is still favoring the bullish recovery. The on-chain side of things reveals that the net transfer volume form/to exchanges dropped slightly from 4 April to 5 April. It also increased significantly in the last 24 hours, reflecting ETH’s current price action.
Source: Glassnode