
The Ethereum(ETH) price resonated between the $3160 and $3000 level for nearly two weeks, creating a narrow range. However, the sellers took advantage of the current uncertainty in the market and breached the bottom support. The range fallout may accelerate the selling momentum and slump the altcoin to $2800.
Key points:
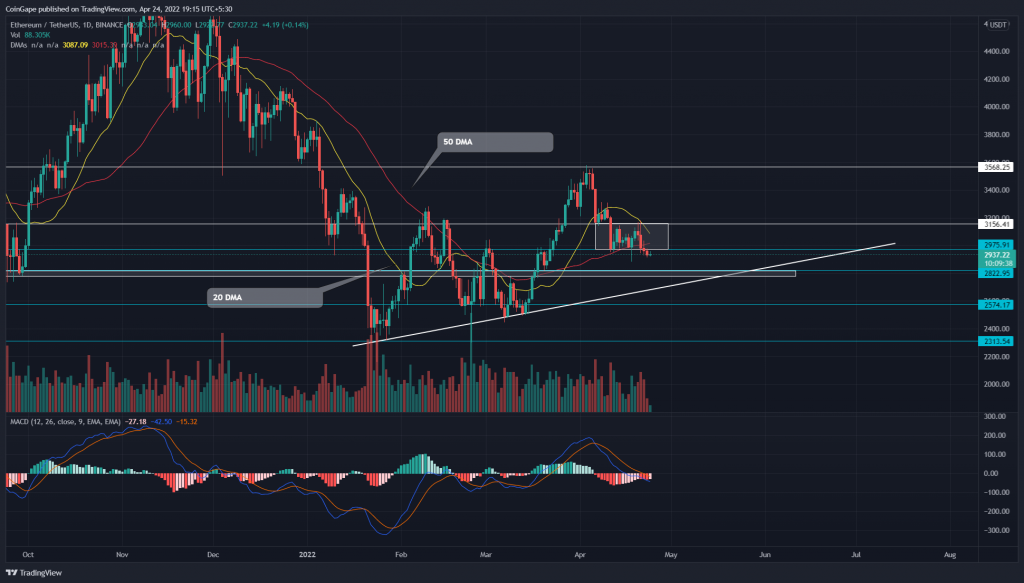
- The 20 and 50 DMAs are preparing a bearish crossover
- The MACD indicator forecasts a bearish continuation
- The intraday trading volume in Ether is $8.05Billion, indicating a 39.5% loss
 Source- Tradingview
Responding to the Bitcoin flash drop beneath the $4500 support, the Ethereum(ETH) price turned down from the $3600 resistance. The minor correction tumbled the altcoin by 16%, bringing it to $3000 psychological support.
Furthermore, the buyers struggled to sustain above the local support, creating a narrow range. However, this consolidation ended in sellers’ favor as the coin price breached the $3000 mark on 22nd April.
The sustained selling pressure may sink the ETH price by another 5%, bringing it to $2800 support.
Trending Stories
Moreover, an upcoming support trendline may strengthen the $2800 support zone and stall the ongoing correction.
Global In/Out of the Money metric

The Global In/Out of the Money (GIOM) on-chain metric suggests for the current Ether price($2918), 69.84% of ETH holders are in profit, whereas 26.8% of holders are in loss.
The nearest green cluster with a mean value of $2672 indicates a significant Area of Interest(AOI) which could help buyers revert the ongoing correction.
On the flip side, the red cluster of $3065 accentuates the importance of this chart level.
Technical Indicator
The MACD indicator shows a falling trend of the fast and slow lines slipping into the negative territory with a considerate growth in bearish histograms. Hence, the indicator forecasts a further continuation of the bearish trend.
The 20 DMA freefall is ready to crack below the 50 DMA to achieve a bearish alignment and signal a selling spot.
- Resistance level: $3281 and $3600
- Support levels: $2750 and $2500