Bitcoin has been on a free fall for the last few days, concluding six consecutive red weeks. The price had recently broken below the $37K level, which had provided solid support for the past months on multiple occasions.
This price collapse was initiated after BTC got rejected when trying to breach the 50-day and 100-day moving average lines and has caused a massive long liquidation cascade and crash to the $30K demand zone.
Technical Analysis
Technical Analysis By Edris
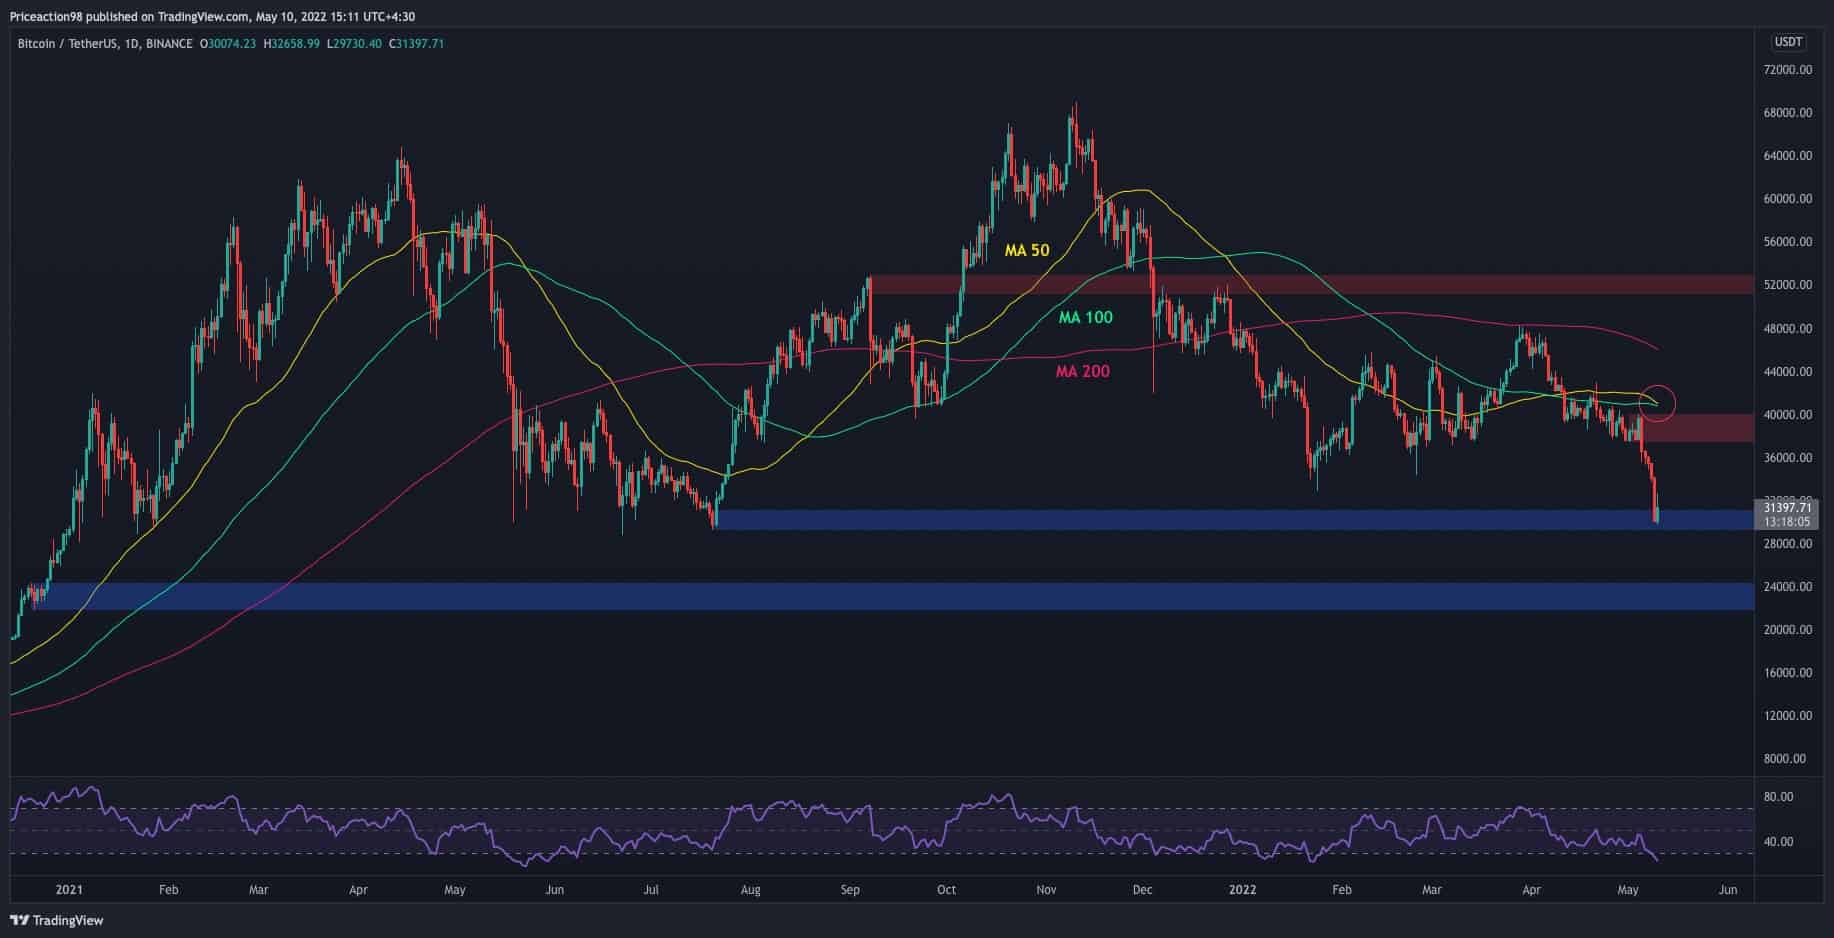
The Daily Chart
Currently, the price seems to find a temp support, as the bulls are buying Bitcoin at the same prices as last year’s bottom area from mid-year.
The $30K is a significant demand zone, and if it holds – the price could rebound towards the $37-40K supply zone in the short term. The RSI also reached the oversold area, which could point on a short-term recovery.
On the other hand, if the bearish momentum continues and the price breaks below the current area, a rapid drop to the $21-24K level could occur. Additionally, a bearish crossover between the 50-day and 100-day moving averages seems imminent, indicating a downtrend continuation scenario.
The 4-Hour Chart
On the 4-hour timeframe, the price has failed to continue the bullish momentum after breaking out of the falling wedge shown on the chart below. This fake breakout and rejection at the $40K zone have worsened the selling pressure, causing the price to break below the marked bearish flag which has been forming over the past few months, validating the downtrend continuation signal and an eventual crash towards $30K.
However, BTC’s price has printed two bullish candles in this timeframe after testing the $30K demand zone, and the RSI indicator seems to be exiting the oversold area (below 30%).
These signals could point to a possible rebound in the short-term towards the $37K resistance level. However, the current bearish momentum seems too strong, hence a breakout below the $30K remains the most probable outcome in the short term, as the bears are in total control of the market.

Onchain Analysis
Onchain Analysis By Shayan
Bitcoin was severely shaken and fell below $30K. The chart shows that the Exchanges’ Netflow indicators soared to multi-month highs, resulting in a dramatic price decline.
In July 2021, the same scenario happened when Bitcoin dropped to $30K and then started a new bullish leg following a final capitulation candle, which resulted in setting a new high in November. Compared to July, the market seems to be in the final stages of capitulation, and after that, a fresh bullish surge might develop in a mid-term perspective (months).
Binance Free $100 (Exclusive): Use this link to register and receive $100 free and 10% off fees on Binance Futures first month (terms).
PrimeXBT Special Offer: Use this link to register & enter POTATO50 code to receive up to $7,000 on your deposits.
Disclaimer: Information found on CryptoPotato is those of writers quoted. It does not represent the opinions of CryptoPotato on whether to buy, sell, or hold any investments. You are advised to conduct your own research before making any investment decisions. Use provided information at your own risk. See Disclaimer for more information.
Cryptocurrency charts by TradingView.