Yesterday marked one of Ripple’s biggest red candles in 2022. Bears were able to push the price down 18% and instill more fear in the market.
Technical Analysis
By Grizzly
The Daily Chart
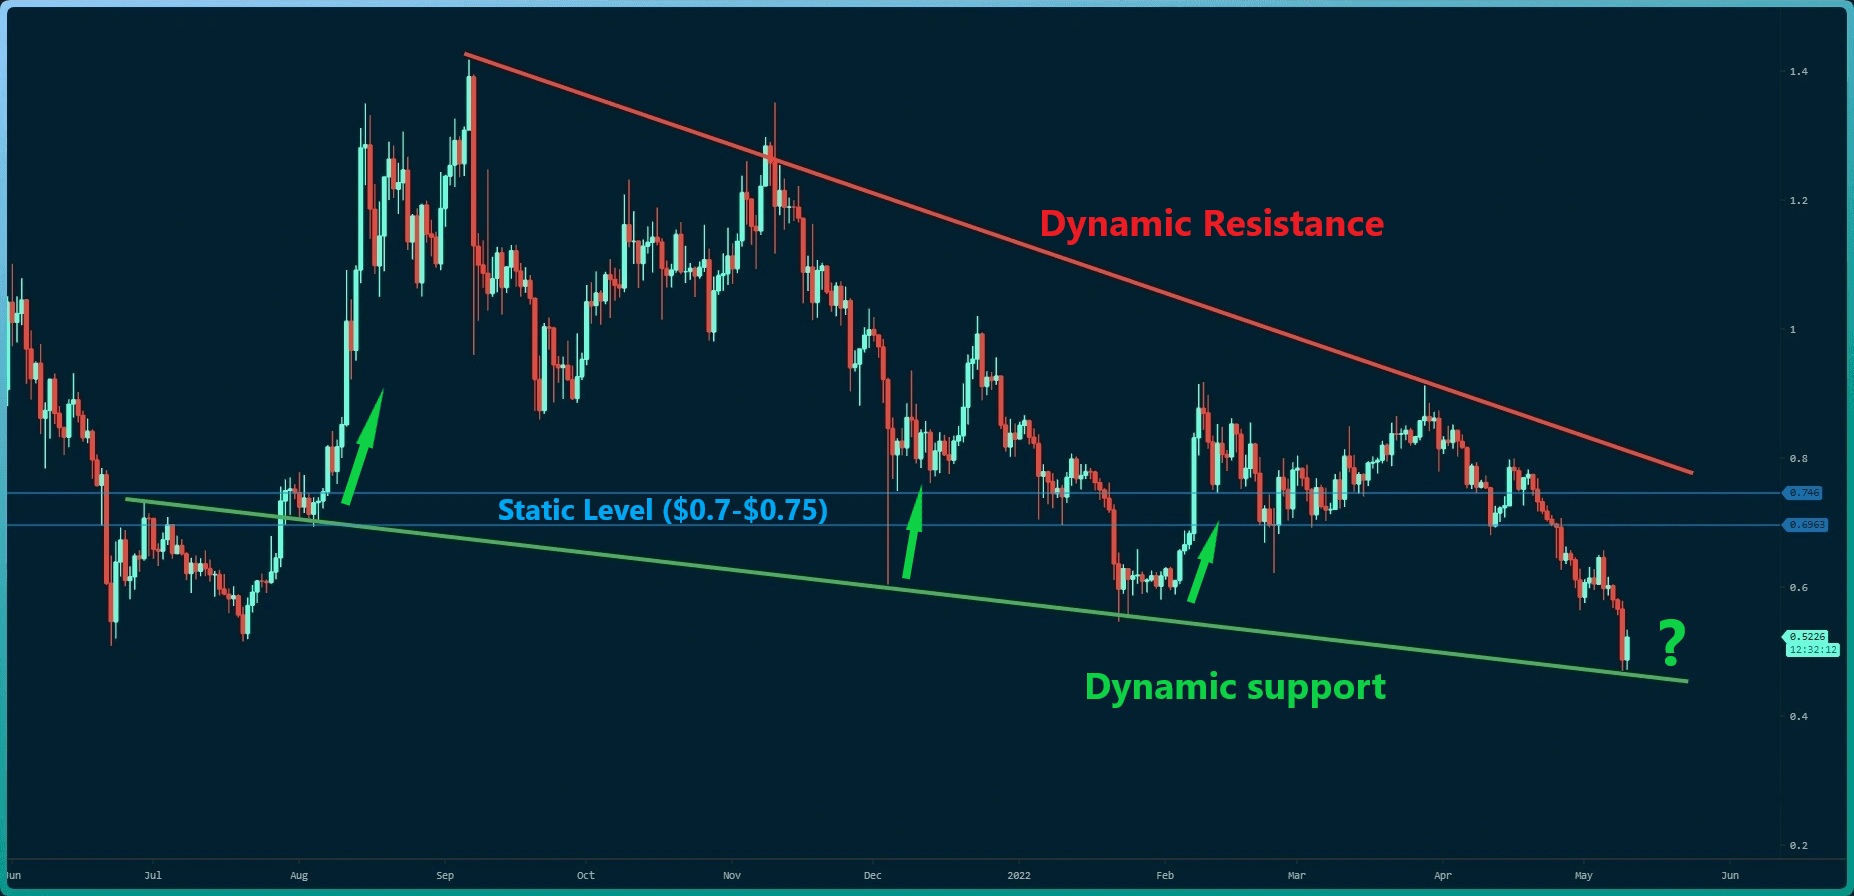
On the daily timeframe, after XRP ended last week in the range between $0.55- $0.65, the price experienced a sharp decline and touched $0.47. Considering the historical trend, the price has increased after hitting the dynamic support (in green). If the bulls want to push the price up towards the wedge’s top (in red), the main challenge would be the resistance between $0.7 and $0.75 (in blue).
Ripple seems to have a challenging path to reach that level because it must first turn back to the last week’s sideways range band. Given the current fear in the market, it is more likely for investors to treat price increases as exit opportunities. This means the volatility is also likely to be very hgih.
Key Support Levels: $0.47 & $0.40
Key Resistance Levels: $0.55 & $0.65
Moving Averages:
MA20: $0.62
MA50: $0.72
MA100: $0.74
MA200: $0.83
The 4-Hour Chart
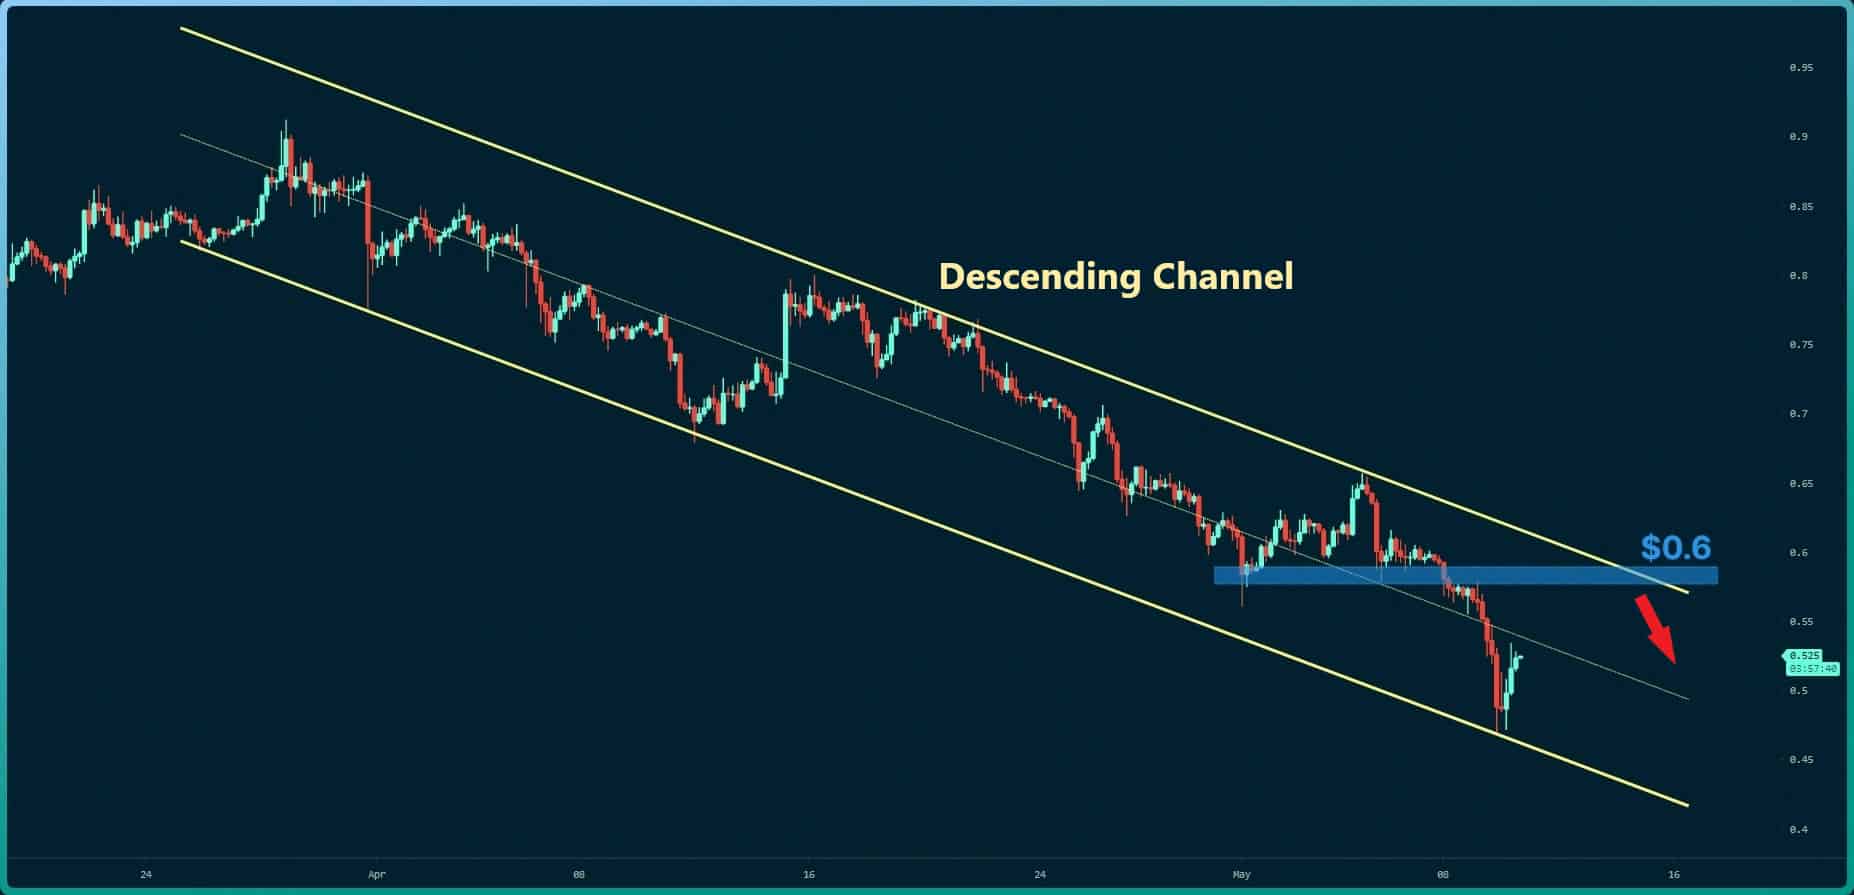
On the 4-hour timeframe, XRP moves down in a descending channel. Currently, the channel bottom is acting well as the support. The price will likely be able to move to the blue zone where the horizontal resistance and the channel top intersect. A reversal signal can be confirmed after forming a higher high at $0.65.
Binance Free $100 (Exclusive): Use this link to register and receive $100 free and 10% off fees on Binance Futures first month (terms).
PrimeXBT Special Offer: Use this link to register & enter POTATO50 code to receive up to $7,000 on your deposits.
Disclaimer: Information found on CryptoPotato is those of writers quoted. It does not represent the opinions of CryptoPotato on whether to buy, sell, or hold any investments. You are advised to conduct your own research before making any investment decisions. Use provided information at your own risk. See Disclaimer for more information.
Cryptocurrency charts by TradingView.