The cryptocurrency market – like most traditional markets – is experiencing a strong crash. Most of the levels at which analysts expected a rebound for Bitcoin has already been lost. BTC is today firmly below the summer 2021 lows of $29,000.
However, some are still pinning their hopes on one model that offers a chance to stop the dramatic decline. This is the Confluence Floor Model, created by popular crypto market analyst @TheRealPlanC. BeInCrypto wrote about this model when it was first presented two months ago.
The Last Hope: Confluence Floor Model
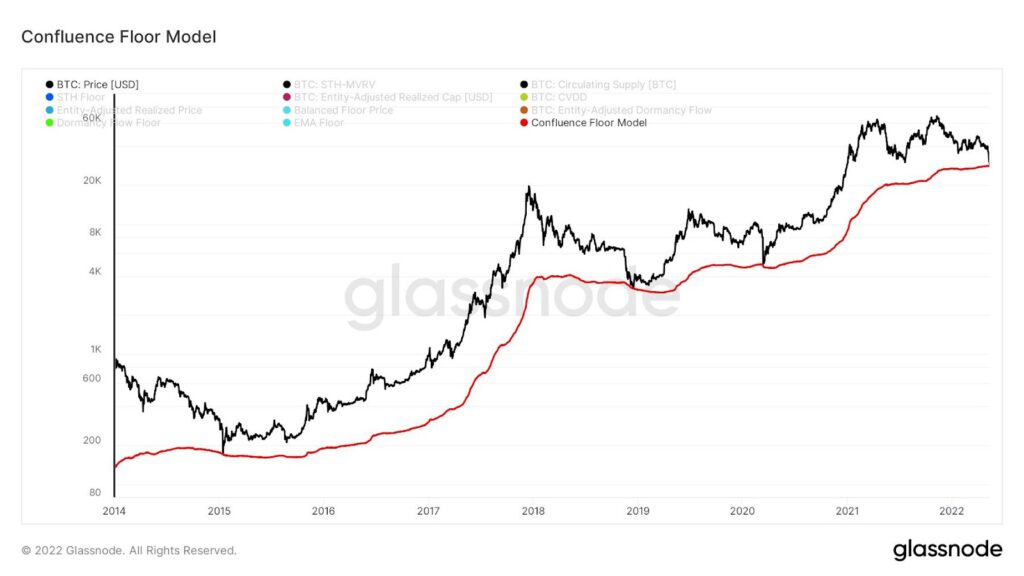
The Confluence Floor Model is developed from three independent floor models that are based on on-chain indicators. According to PlanC, its historical effectiveness is much greater than the traditionally accepted 200-week moving average (200D SMA), which usually marked the area of the absolute bottom for BTC. It is worth noting that the 200D SMA is located today at $21,839.
So where does the Confluence Floor Model predict a possible bottom for Bitcoin? According to a tweet published today, the chart of the indicator reached $27,688 today. This means that the price of BTC near $28,000 at the press time is almost exactly in this area.
Below his chart, PlanC adds a comment: “To remind everyone this is a daily close floor model. I said many times that it could see intraday wicks below it. As far as if I believe in it still. It has never been broken, so until it is I feel it is useful and once it breaks then it is not.”
The historical effectiveness of the model
Despite the fact that the Confluence Floor Model itself was created recently, its historical effectiveness seems impressive. The author often points out that in the entire history of the Bitcoin price, no daily candle has closed below its red line.
According to the data and a recent tweet, the model points very well to the lows of previous bear markets and the March 2020 black swan crash:
Bitcoin’s price is today about 60% below its all-time high of $69,000 reached on November 10, 2021. If this were to be the bottom of the current bear market, firstly it would be reached relatively quickly and secondly, it would be shallower than previous ones. Historical bear markets have driven BTC about 80-90% below the ATH.
On the other hand, the ATH first established in April 2021 and later surpassed in November 2021 was not preceded by such an exponential rise in the BTC price as in previous bull markets.
Therefore, as long as the daily BTC candle does not close below the $27,688 level set by the Confluence Floor Model, there is a chance that the model will work again. However, if the declines do not stop, the model will be invalidated and crypto market analysts will start looking for the next “hopium”.
For BeInCrypto’s latest Bitcoin (BTC) analysis, click here.
Disclaimer
All the information contained on our website is published in good faith and for general information purposes only. Any action the reader takes upon the information found on our website is strictly at their own risk.