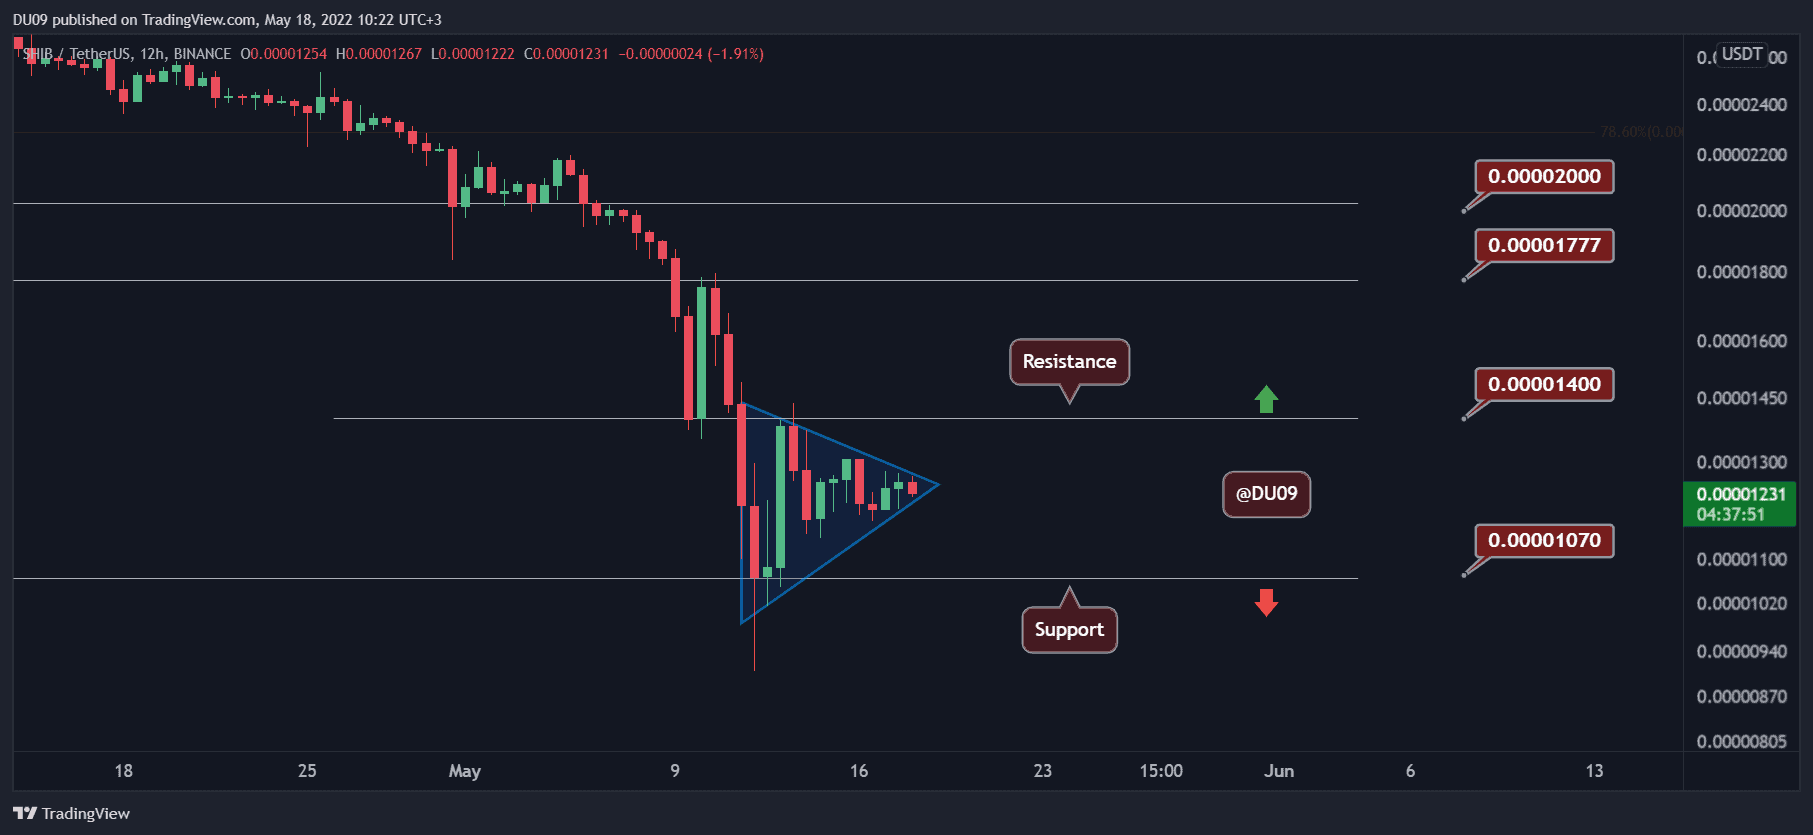
Volatility has decreased since the crash on May 12th, and the price appears to be staging a significant move soon.
Key Support level: $0.000010
Key Resistance level: $0.000014, $0.000017
SHIB has formed a large pennant (in blue in the chart below) which can break as soon as volatility returns. The current support is found at $0.000010, and the indicators suggest a bullish move might be in the cards soon, where SHIB could test the key resistance at $0.000014.
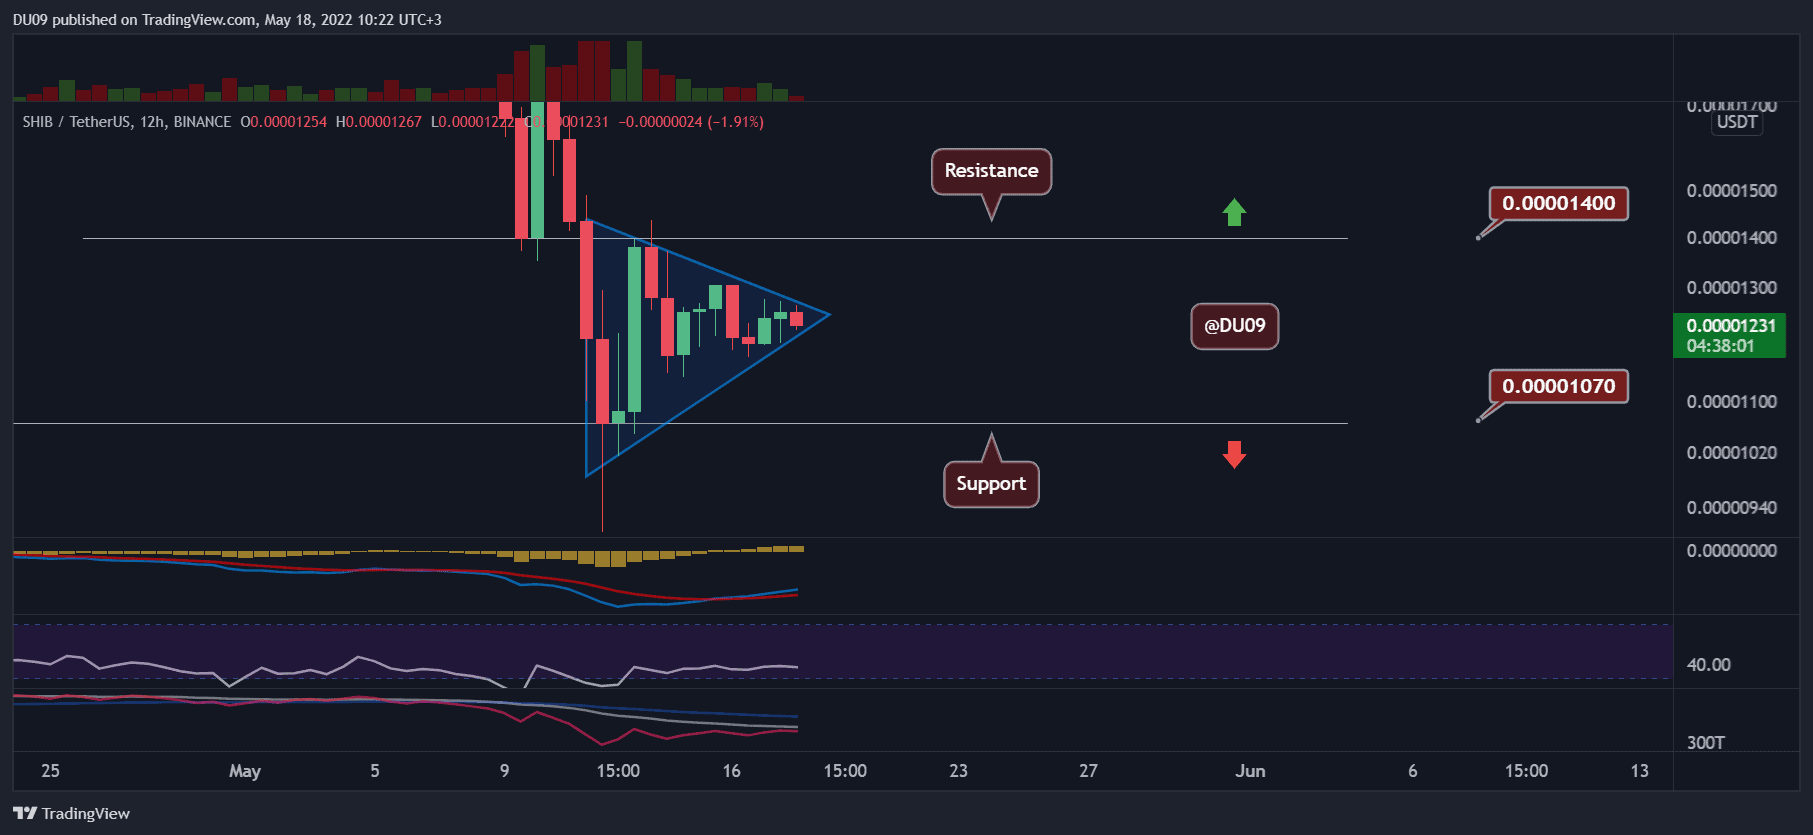
Technical Indicators
Trading Volume: The volume has been low lately, but this is likely to change as soon as a break from the current formation takes place.
RSI: The daily RSI is making higher lows, and it is about to also make a higher high. If this move intensifies, then the bias for SHIB could flip to bullish.
MACD: The daily MACD is still bearish, but the histogram is bullish. A few days of this price action – and the key resistance may be tested.
Bias
The bias on SHIB is neutral. This can change to bullish if it breaks above the pennant.
Short-Term Prediction for SHIB Price
A test of the key resistance at $0.000014 appears likely, but only if the price manages to break above its current levels on renewed momentum. If successful, SHIB’s next key resistance will be found at $0.000017.
Binance Free $100 (Exclusive): Use this link to register and receive $100 free and 10% off fees on Binance Futures first month (terms).
PrimeXBT Special Offer: Use this link to register & enter POTATO50 code to receive up to $7,000 on your deposits.
Disclaimer: Information found on CryptoPotato is those of writers quoted. It does not represent the opinions of CryptoPotato on whether to buy, sell, or hold any investments. You are advised to conduct your own research before making any investment decisions. Use provided information at your own risk. See Disclaimer for more information.
Cryptocurrency charts by TradingView.