Disclaimer: The information presented does not constitute financial, investment, trading, or other types of advice and is solely the opinion of the writer.
Since the 12 May drop, Monero has been one of the larger altcoins which have had quite an impressive performance on the price charts. Ranked 25th by market capitalization, Monero’s plunge to $133 was followed by an impressive 70% rally to reach the $207 mark. This came at a time when Bitcoin traded within a range, making the short-term bullishness of Monero all the more enticing for buyers.
However, at press time, the structure on the lower timeframes appeared to have flipped to bearish once more.
XMR- 4 Hour Chart
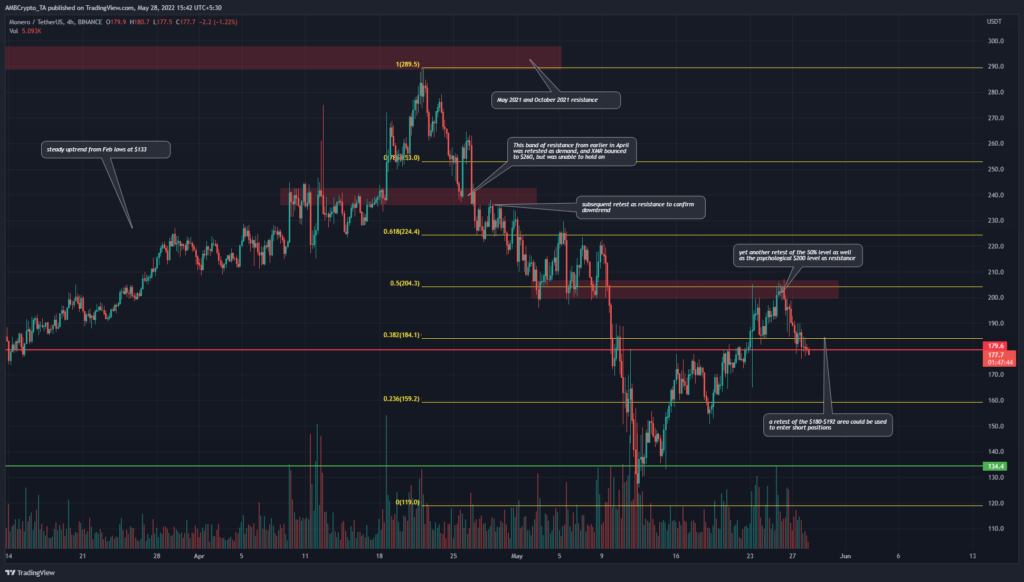
On the 4-hour chart, it can be seen how XMR slowly trended upward in February through mid-April, to reach the $289.5 mark. This, however, was a longer-term zone of resistance stretching back to October last year. The price faced rejection at this resistance zone and plunged lower, all the way to $119 on May 12.
On the way down, the price stalled at the $200 zone of support, highlighting this psychological round number’s importance to traders and investors. The Fibonacci retracement levels (yellow) plotted for XMR’s drop from $289.5 to $119 highlighted the $224.4 and $253 levels as critical resistances, as they are the 61.8% and 78.6% retracement levels respectively.
A few days ago, the price once more faced stiff resistance at the aforementioned $200 zone, which had confluence from the 50% retracement level as well. Moreover, the price slipped beneath the 38.2% retracement level to indicate that bears might have the upper hand.
XMR- 1 Hour Chart

Source: XMR/USDT on TradingView
On the lower timeframes, it can be seen that the breakout past the $155.8 level (white) signaled short-term bullish bias, and saw XMR rise to $207.2. However, this bullish bias was flipped back to bearish when the price closed a trading session below $181.6.
The $182-$188 area has acted as support over the past week, but it has been flipped to resistance and could be retested once again. Such a retest can be used to enter a short position, targeting the previous support at $155 area as a take-profit. The stop-loss can be set just above $190, or even $193 to allow some extra margin for error.

Source: XMR/USDT on TradingView
The reason that a short position need not be entered right away, despite a market structure break and retest of $182 as resistance, is that the OBV has not seen a deep drop despite the rejection at the $200 zone.
Even though the RSI was below neutral 50, and the Awesome Oscillator beneath its zero line, both the momentum indicators made higher lows while XMR made lower lows. Hence, a minor bounce could materialize, before the next wave of selling.
Conclusion
Bitcoin was trading within a tight range from $28.7k to $30.6k, and until BTC closes a D1 trading session below $28.7k, there remains the possibility of a bounce toward the range highs. This could see XMR rise back toward $200.
Therefore, while a retest of the $183 mark can be used to enter a short position, further gains toward $190 remain a possibility. A drop in XMR’s 1-hour OBV would be a strong signal of selling intent. Patience could be the key for this short trade, whose target would be $155.
As always, risk management and position sizing are key in trading, and a trader should remember to risk only 2% of their account or preferably lesser on each trade they enter.