Bitcoin’s price has been consolidating for almost a month, as the price failed to break below or rebound from the $30K area over an extended period. This is a significant level as it has previously held the price during last year’s crash from the $64K all-time high (from April 2021), and it could support the cryptocurrency for a short-term rally once again.
Technical Analysis
By: Edris
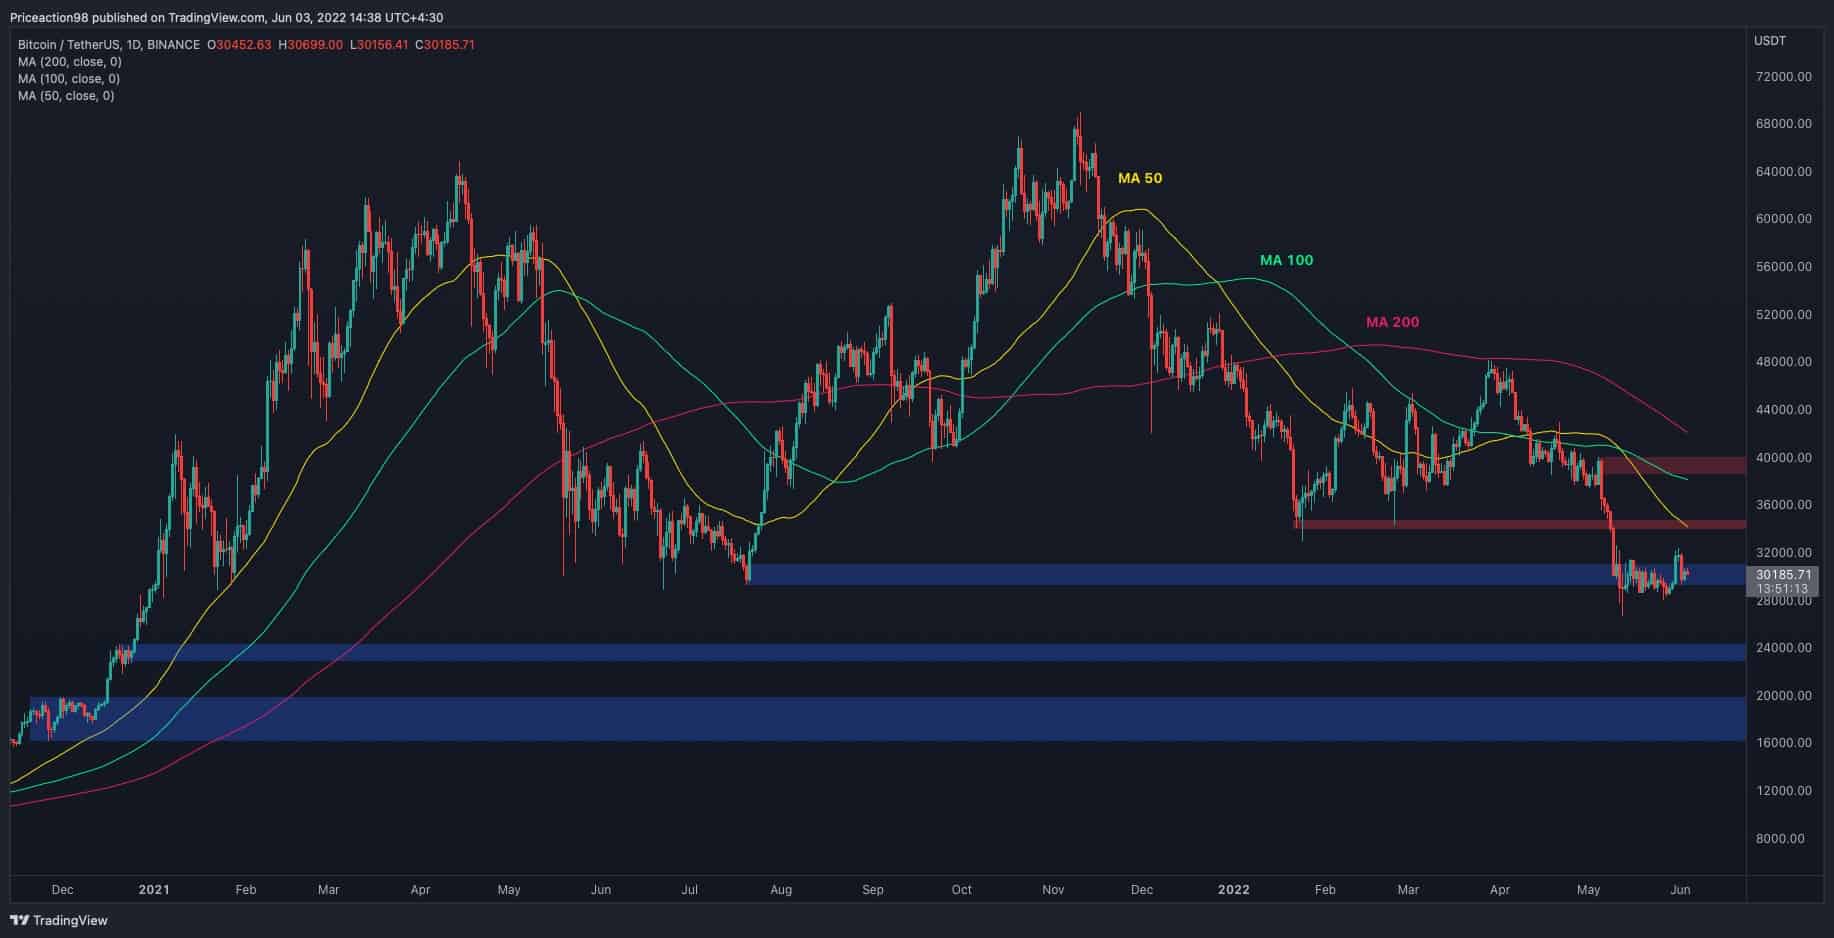
The Daily Chart
If a bullish move occurs, the 50-day moving average and the $35K zone would be the first resistance levels that could be targeted. On the other hand, if the price breaks below the current $28K-$30K support area, another impulsive bearish leg towards the $24K and eventually the $17K-$20K area is feasible. This could mark the bottom of this bear market. For the trend to be considered bullish again, the price would have to break above the 200-day moving average, which is currently around the $42K mark.
The 1-Hour Chart
On the 1-hour timeframe, the price oscillates in a tight range between $28K and $31K, hunting stop losses and trapping both bulls and bears on either side. The cryptocurrency has been forming a falling wedge while dropping to the lower boundary of the range at $28K and has even wicked below the level, stopping the bulls out and tempting the bears to open shorts on the bearish breakout.
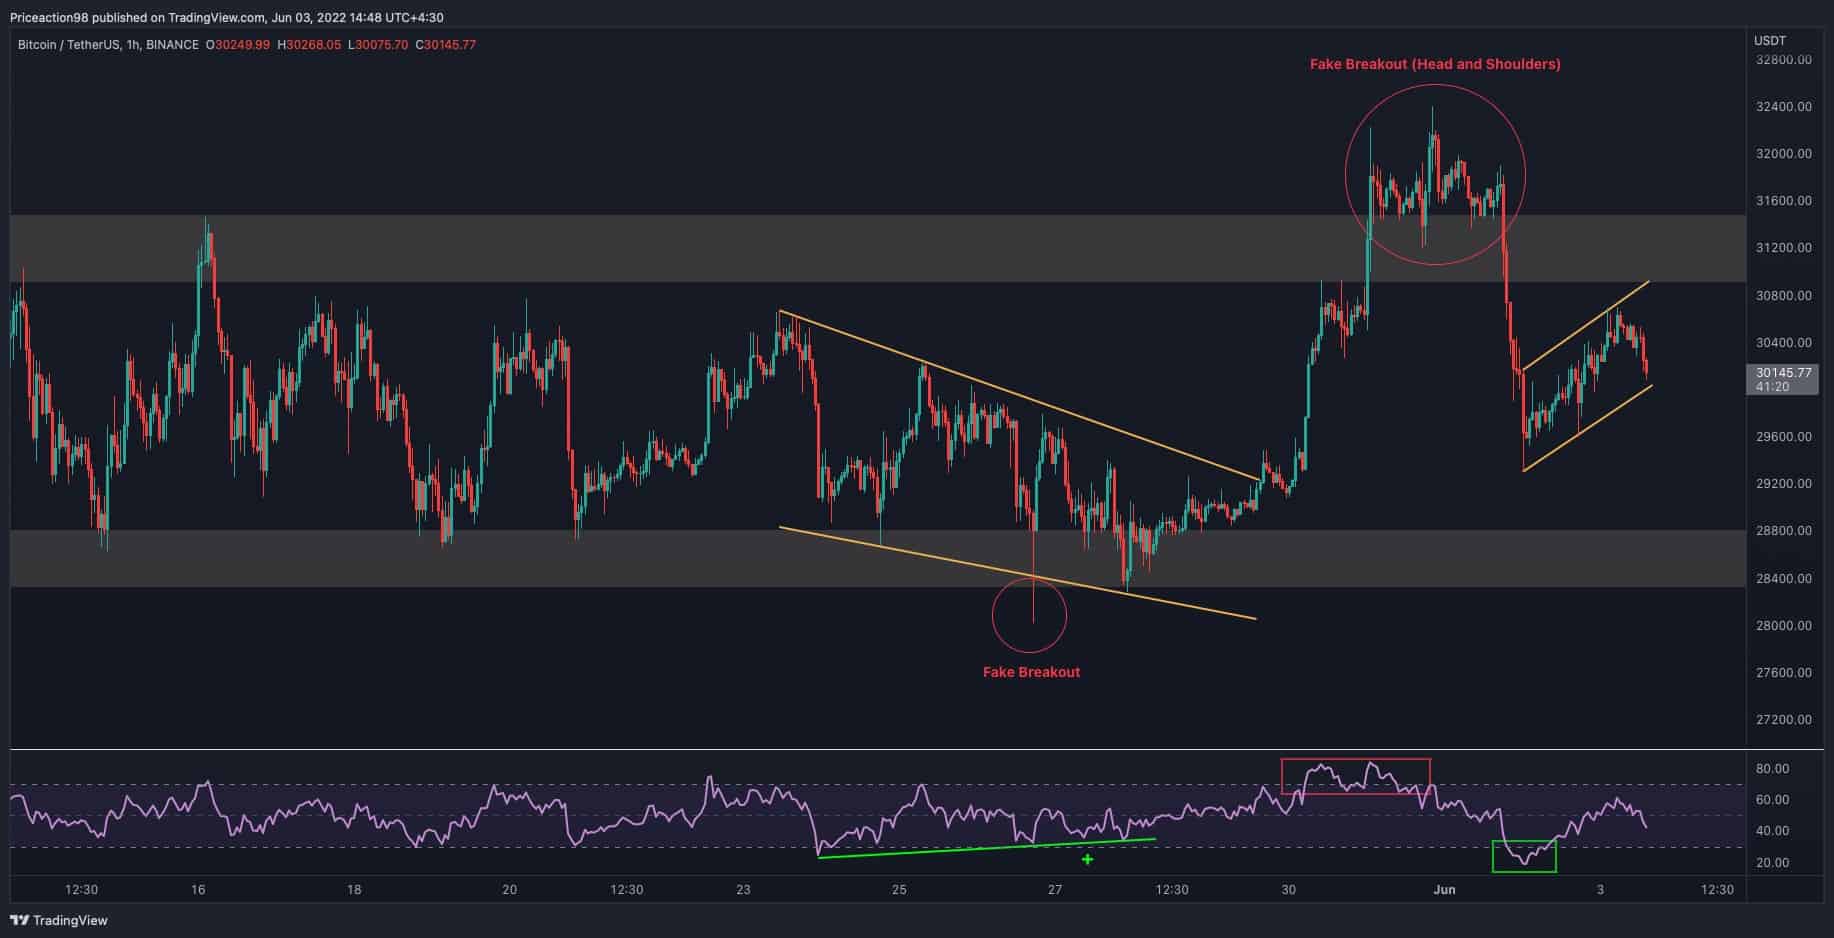
This price action turned out to be a fake breakout as the RSI indicator was signaling a bullish divergence. BTC has rebounded from $28K, breaking above the falling wedge pattern, before reversing to the downside.
Currently, the bears are in control again as the price has made an impulsive bearish move followed by a bearish flag pattern indicating heading towards the lower threshold of the range is possible. If the price finally breaks below this range, a drop to the $24K level would be expected.
On-Chain Analysis
By: Edris
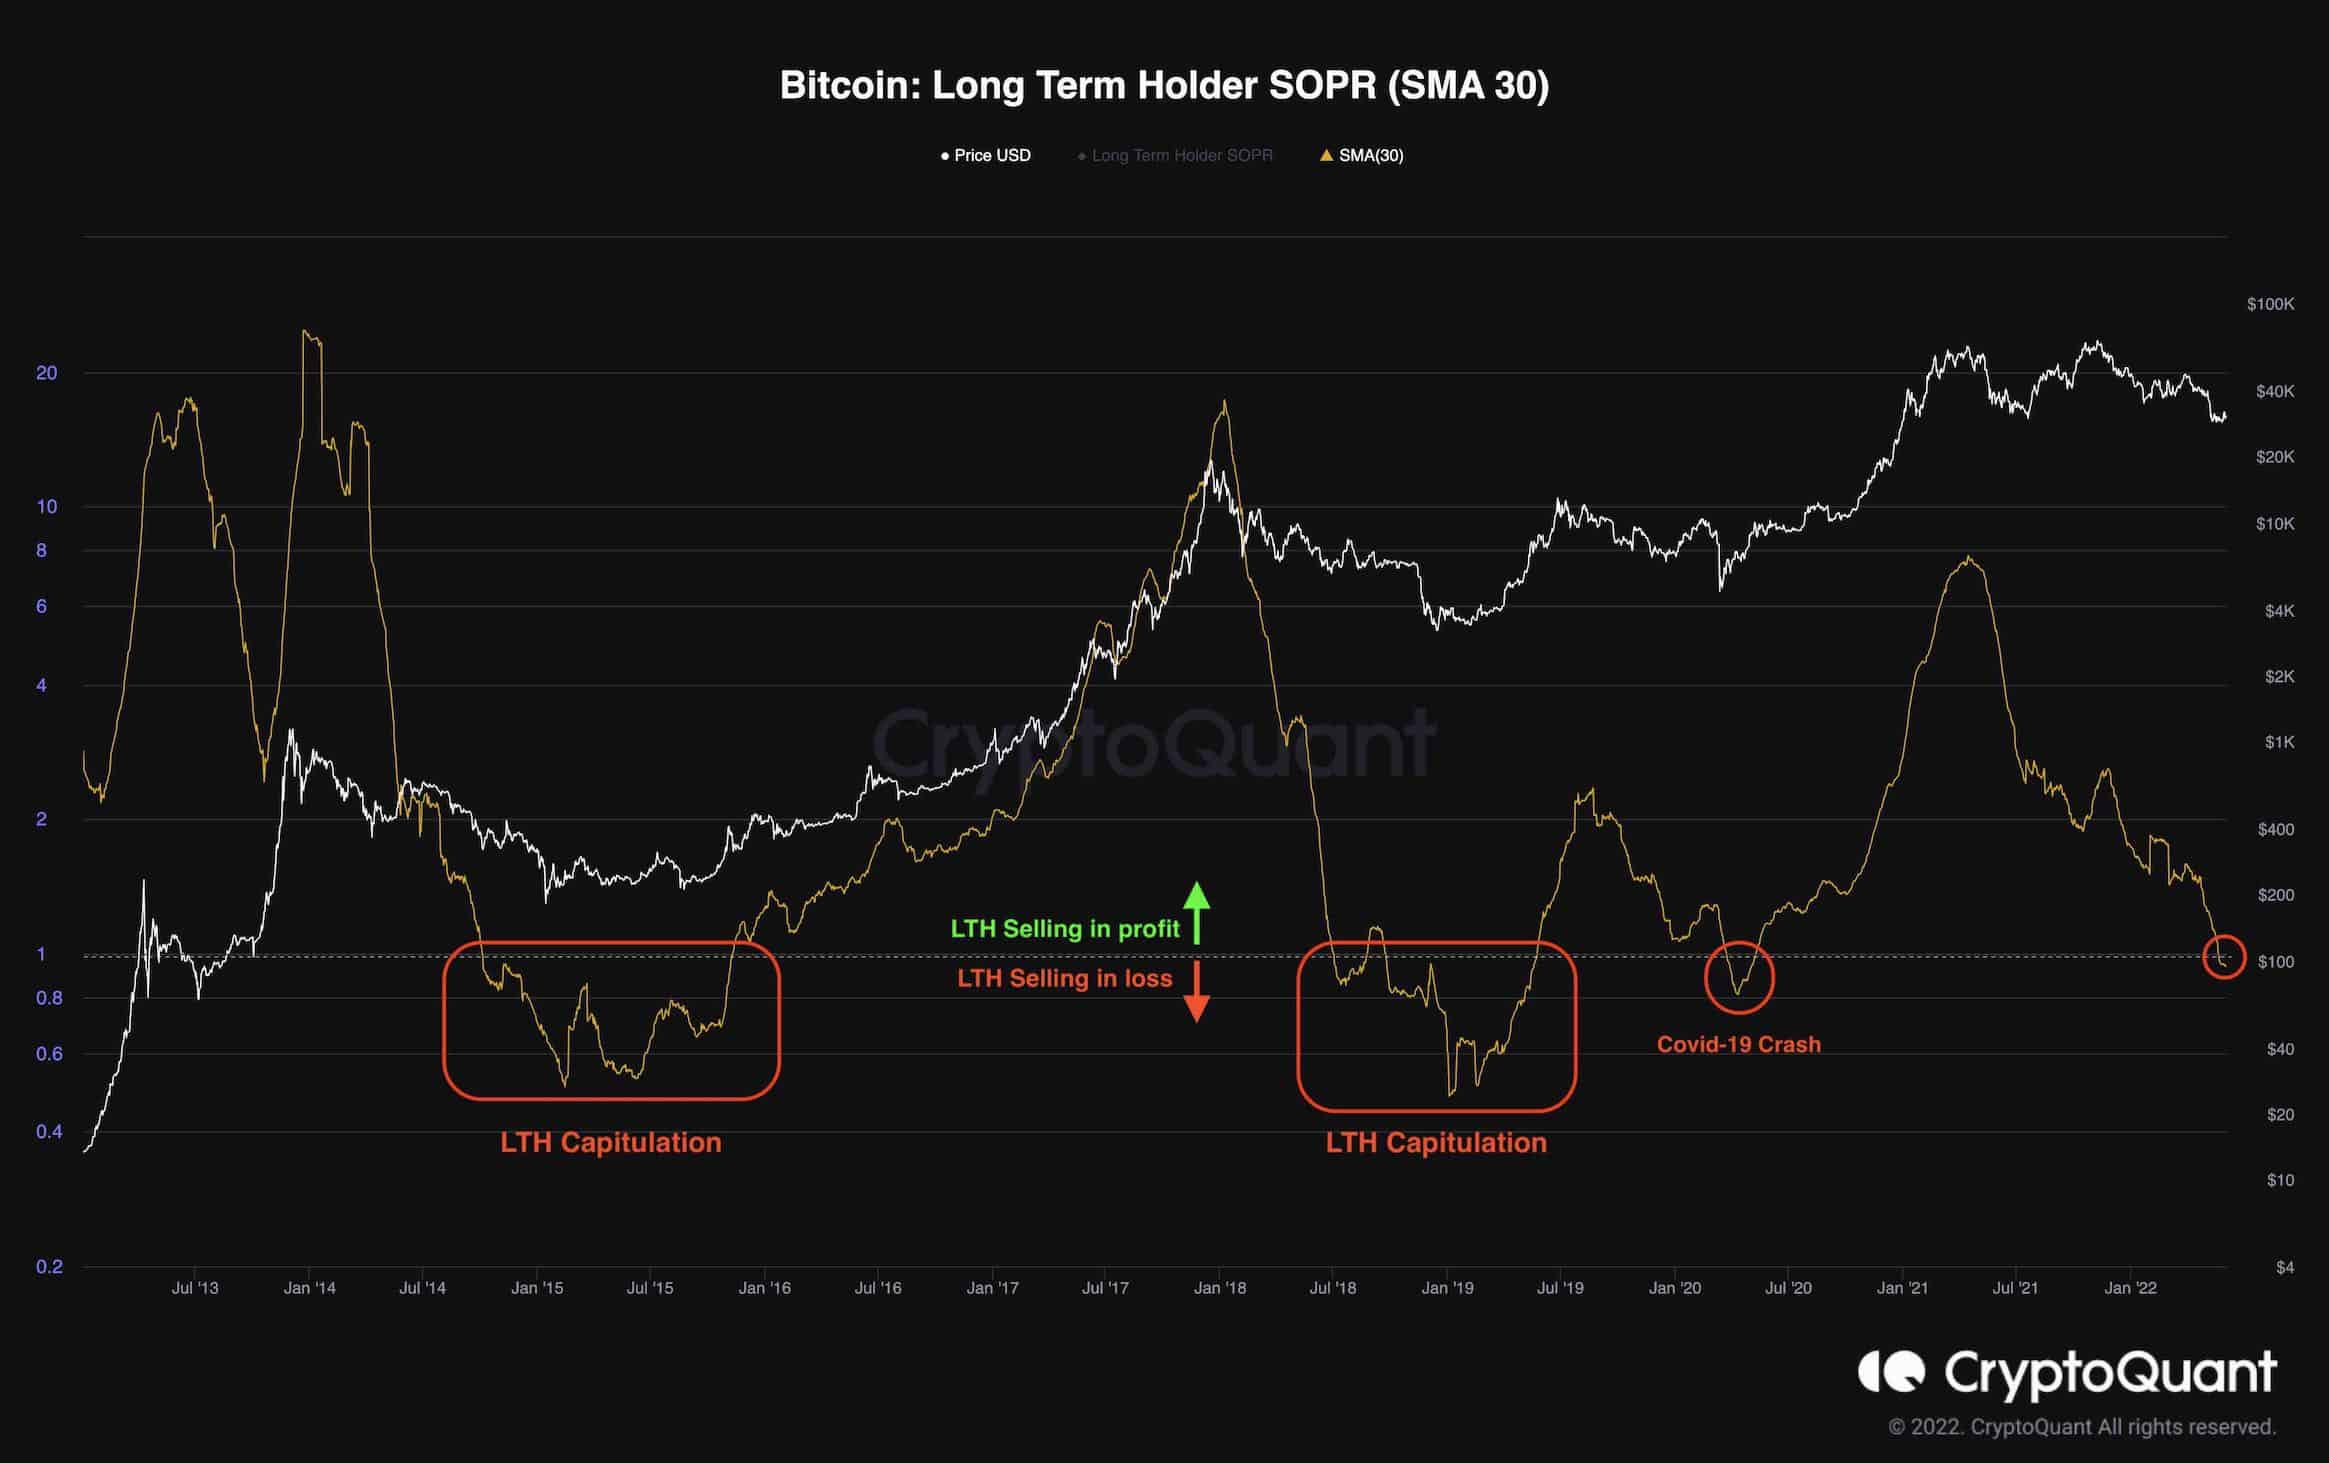
Bitcoin Long Term Holder SOPR (SMA 30)
Markets usually tend to put a bottom when massive losses are inflicted on the market participants, signaling “Capitulation.”
In the Bitcoin market, there is a lot of emphasis on the capitulation of short-term holders, as it helps to identify local bottoms in the middle of a long-term bullish trend.
However, short-term holders’ capitulation in bear markets is not a very helpful indicator as most of the supply is held by the long-term holders. A long-term holders’ capitulation phase is needed for a multi-year bottom to form.
The chart above demonstrates the long-term holders’ SOPR – a metric that measures the amount of profits/losses realized by this cohort. Values above 1 indicate profits, and below one are associated with realized losses.
It is evident that during previous bear markets, a lengthy period of long-term holders’ capitulation occurred as these participants were exiting the market at a loss. The long-term holders’ capitulation phase coincides with the Smart Money accumulation phase. Currently, the long-term holders are entering the capitulation phase. They are selling at a loss, indicating that the smart money accumulation phase has begun.
Binance Free $100 (Exclusive): Use this link to register and receive $100 free and 10% off fees on Binance Futures first month (terms).
PrimeXBT Special Offer: Use this link to register & enter POTATO50 code to receive up to $7,000 on your deposits.
Disclaimer: Information found on CryptoPotato is those of writers quoted. It does not represent the opinions of CryptoPotato on whether to buy, sell, or hold any investments. You are advised to conduct your own research before making any investment decisions. Use provided information at your own risk. See Disclaimer for more information.
Cryptocurrency charts by TradingView.