Disclaimer: The information presented does not constitute financial, investment, trading, or other types of advice and is solely the opinion of the writer.
At the start of June, Ethereum [ETH] was trading at $1,980. The $1,750-$1,950 range was a long-term support zone for Ethereum. It was speculated that ETH might halt its nosedive in that area and begin to move back higher. However, a swift plunge beneath $1,900 and $1,750 saw Ethereum fall headfirst once more. This drop took the altcoin to the $890 region.
At press time, a bounce toward $1,075 appeared a possibility. However, indicators and charts, both showed that such a move would present selling opportunities.
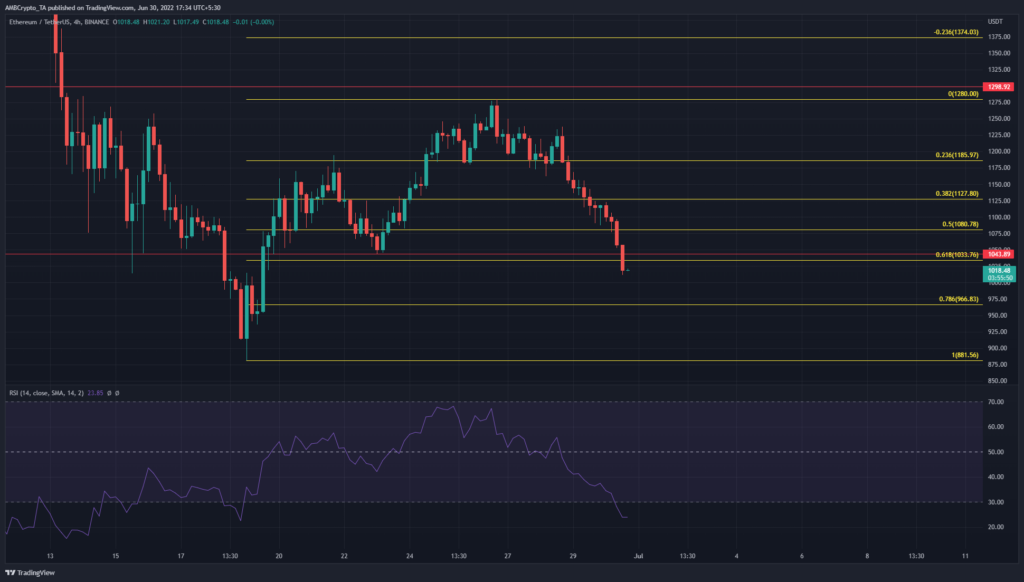
ETH- 4-Hour Chart
On the four-hour chart, the bounce from $881 to $1,280 was used to plot a set of Fibonacci retracement levels (yellow). In the past few hours of trading, the price crashed through both the $1,043 horizontal long-term support level, as well as the 61.8% retracement level at $1,033.
A week prior to this, the $1,043 support had been respected. The recent plunge back beneath this level meant that the bias was strongly bearish once more. The market structure showed that new lows could be sought. The RSI was also deep within the bearish territory and flashed a value of 23.
The previous lows at $880 could be a level reached in a few weeks. Further south, there is some confluence between the 27.2% Fibonacci extension level at $773, and a long-term horizontal support level at $756.
ETH- 1 Hour Chart

Source: ETH/USDT on Tradingview
Zooming in to the one-hour timeframe, it can be seen that the past couple of days have seen severe selling pressure. ETH has shed nearly 17% in less than 48 hours.
A revisit to the $1,060-$1,080 area could be on the cards. This area was where ETH had found strong support a week ago, and a retest from below would confirm it as a supply region. Such a retest can also be used to enter short positions targeting the $880-$900 region.

Source: ETH/USDT on Tradingview
The hourly timeframe showed the RSI to be at 17. While such deeply oversold values do not automatically guarantee a bounce, they also do not offer good risk-to-reward entries. Therefore, it might pay to wait a few more hours for a more opportune moment to enter a short position on ETH.
The OBV has sharply dipped in recent days, alongside the CMF. Together, they showed enormous selling pressure behind Ethereum. The DMI also showed a heavy downward trend in progress. The ADX (yellow) and the -DI (red) were both well above the 20 mark.
Conclusion
The four-hour chart highlighted the former bearish trend behind ETH and also highlighted how the bulls were unable to defend the $1,080 area. A revisit to this region might or might not occur, but a revisit would offer an ideal entry to a short position.