The sideways trend for XRP has continued for the last three weeks. The price fluctuates between $0.3 and $0.4. Meanwhile, some technical indicators signal a possible bullish divergence.
Technical Analysis
By Grizzly
The Daily Chart
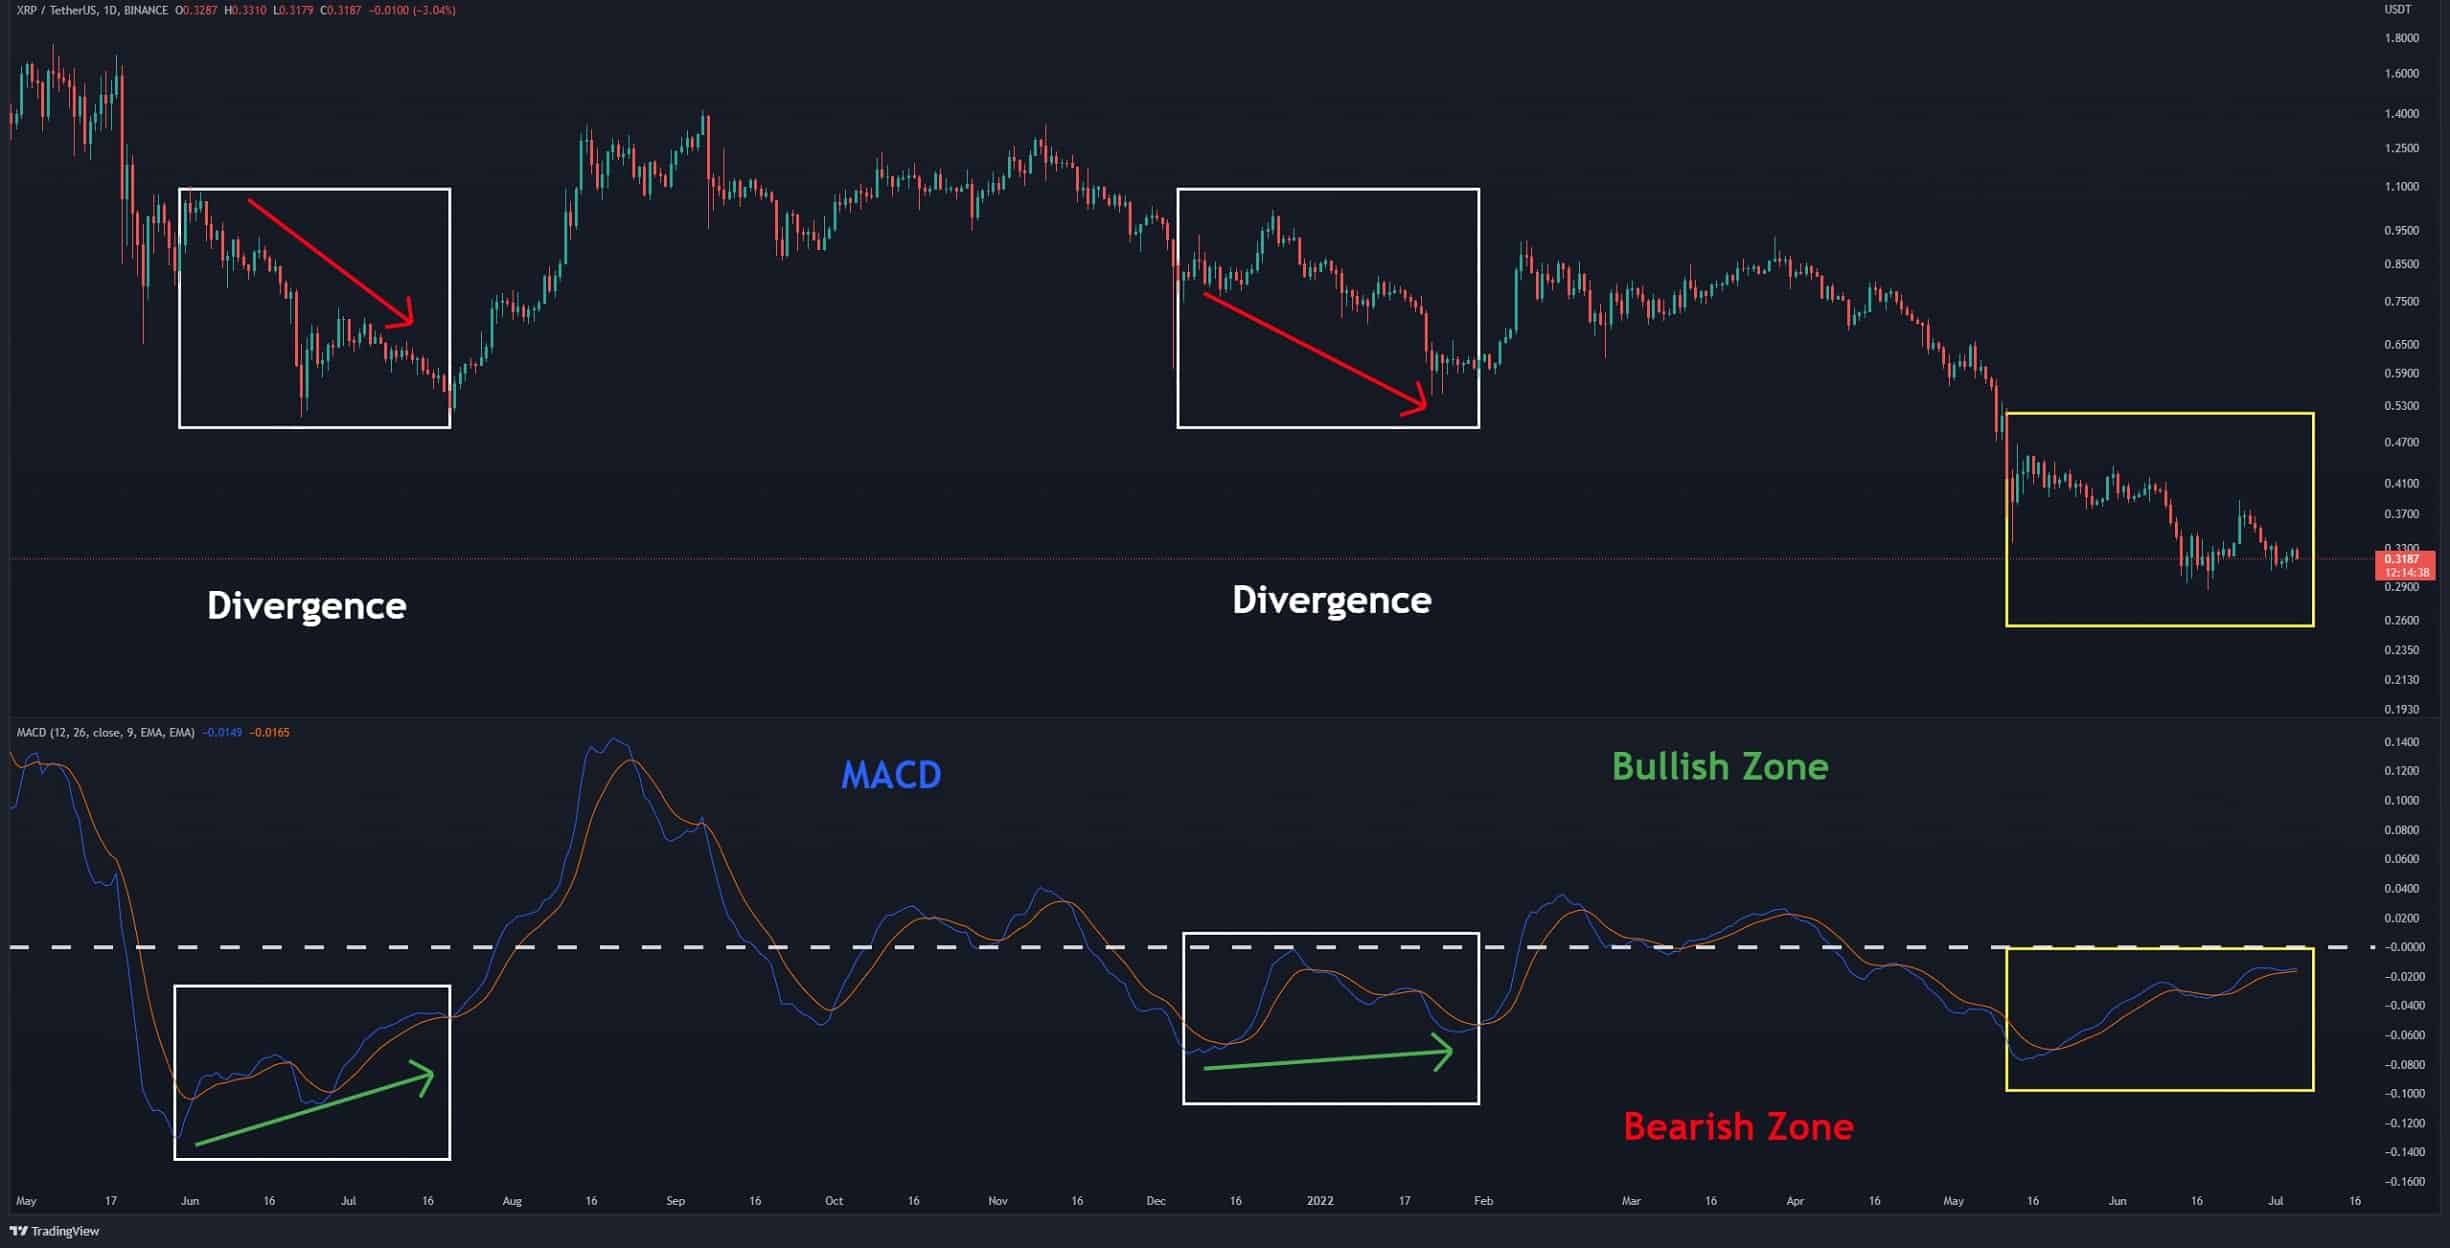
Looking at the MACD on the daily chart reveals that during previous drawdowns, the bearish momentum decreased in the short term when this indicator formed a positive divergence with the price (white rectangle). A bullish divergence can be defined as intervals when the price moves down, but the indicator trends towards the upside.
On frequent occasions, shortly after this index moves into the bullish zone (above the baseline), the buyers tend to overcome the sellers. Currently, despite the divergence (yellow rectangle), the indicator is still in the bearish zone. One can expect a relief rally to start if it breaks the baseline upwards.
Key Support Levels: $0.30 & $0.24
Key Resistance Levels: $0.38 & $0.45
Moving Averages:
MA20: $0.33
MA50: $0.37
MA100: $0.52
MA200: $0.64
The XRP/BTC Chart
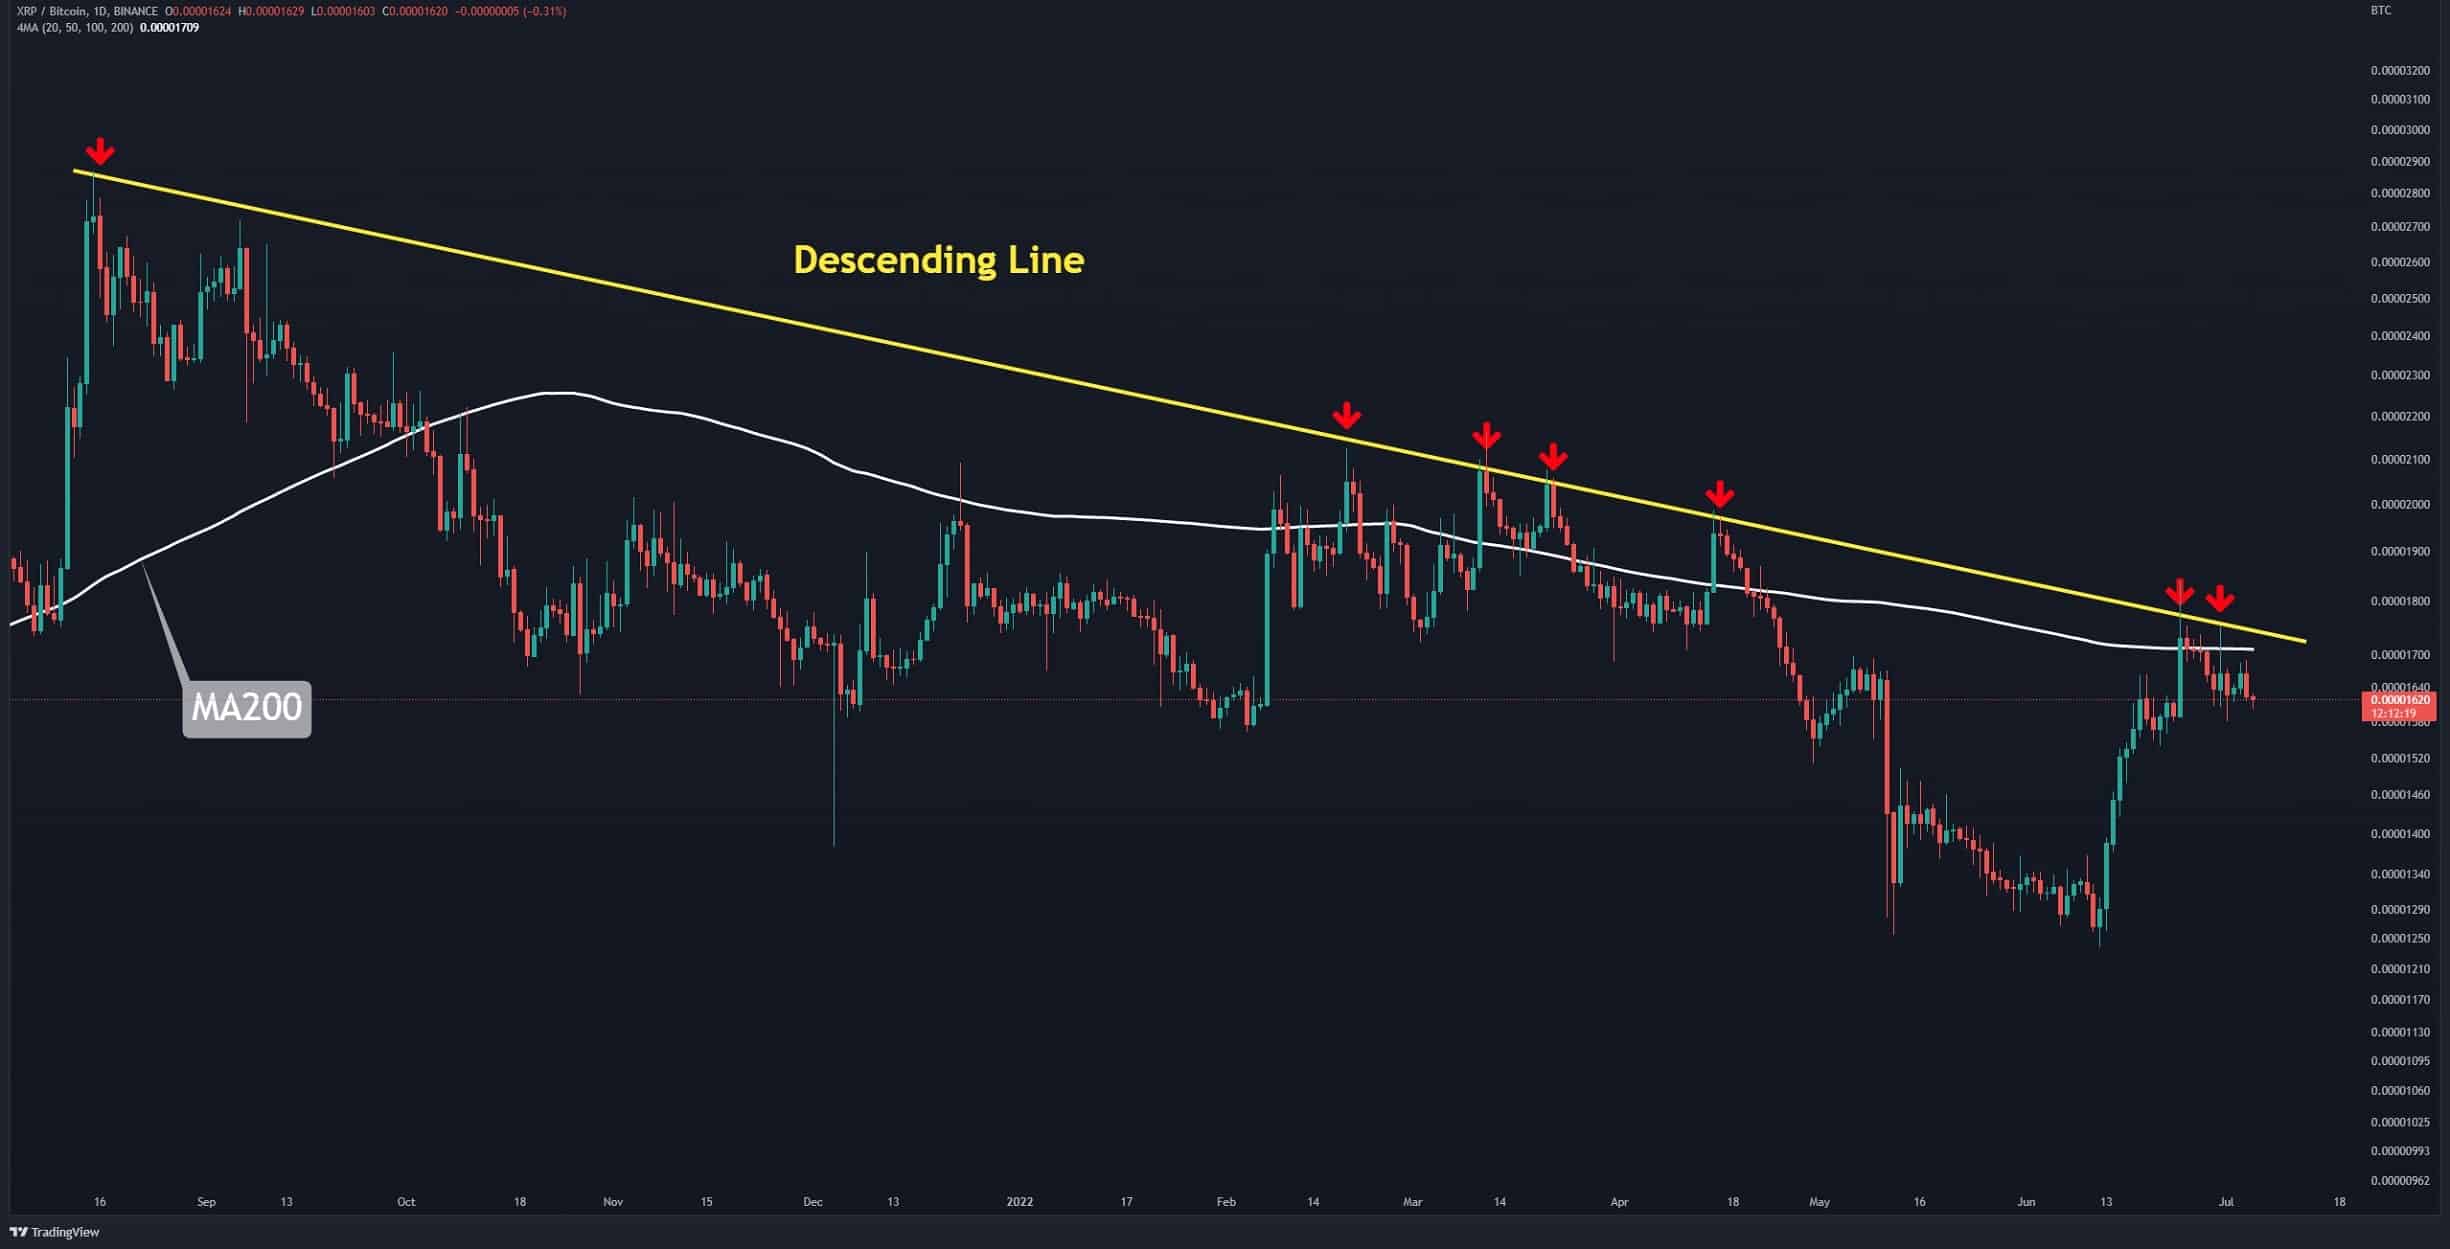
Against BTC, XRP is still struggling with the resistance zone formed by the intersection of the descending line (in yellow) and the daily MA200 (in white). This area is located between 1700 and 1800 sats. The price of Ripple against Bitcoin has not managed to cross this resistance line since August 2021. If the buyers push it above, the way to reach higher levels becomes increasingly easier. Also, new buyers might be convinced that the price has the necessary momentum to move further, and this could accelerate the upward trend.
Key Support Levels: 1500 Sats & 1250 Sats
Key Resistance Levels: 1700 Sats & 1800 Sats
Binance Free $100 (Exclusive): Use this link to register and receive $100 free and 10% off fees on Binance Futures first month (terms).
PrimeXBT Special Offer: Use this link to register & enter POTATO50 code to receive up to $7,000 on your deposits.
Disclaimer: Information found on CryptoPotato is those of writers quoted. It does not represent the opinions of CryptoPotato on whether to buy, sell, or hold any investments. You are advised to conduct your own research before making any investment decisions. Use provided information at your own risk. See Disclaimer for more information.
Cryptocurrency charts by TradingView.