
Published 32 mins ago
The GALA/USDT chart shows the formation of a rounding bottom pattern in the daily time frame chart. The coin price is currently at the midline stage of this pattern called the accumulation phase. Amid the recent recovery in the crypto market, the GALA price bounced back from the bottom support of $0.0475-$0.0448 on July 26th. Thus, the bullish reversal drove the prices 54.8% higher, where it formed a local top at $0.0705.
advertisement
Key points from GALA analysis:
- The rounding bottom pattern governs the GALA price action
- The daily candle closing below $0.0656 is needed for a 10.5% fall in market price
- The intraday trading volume in the GALA is $318.8 Million indicating a 7.82% loss.
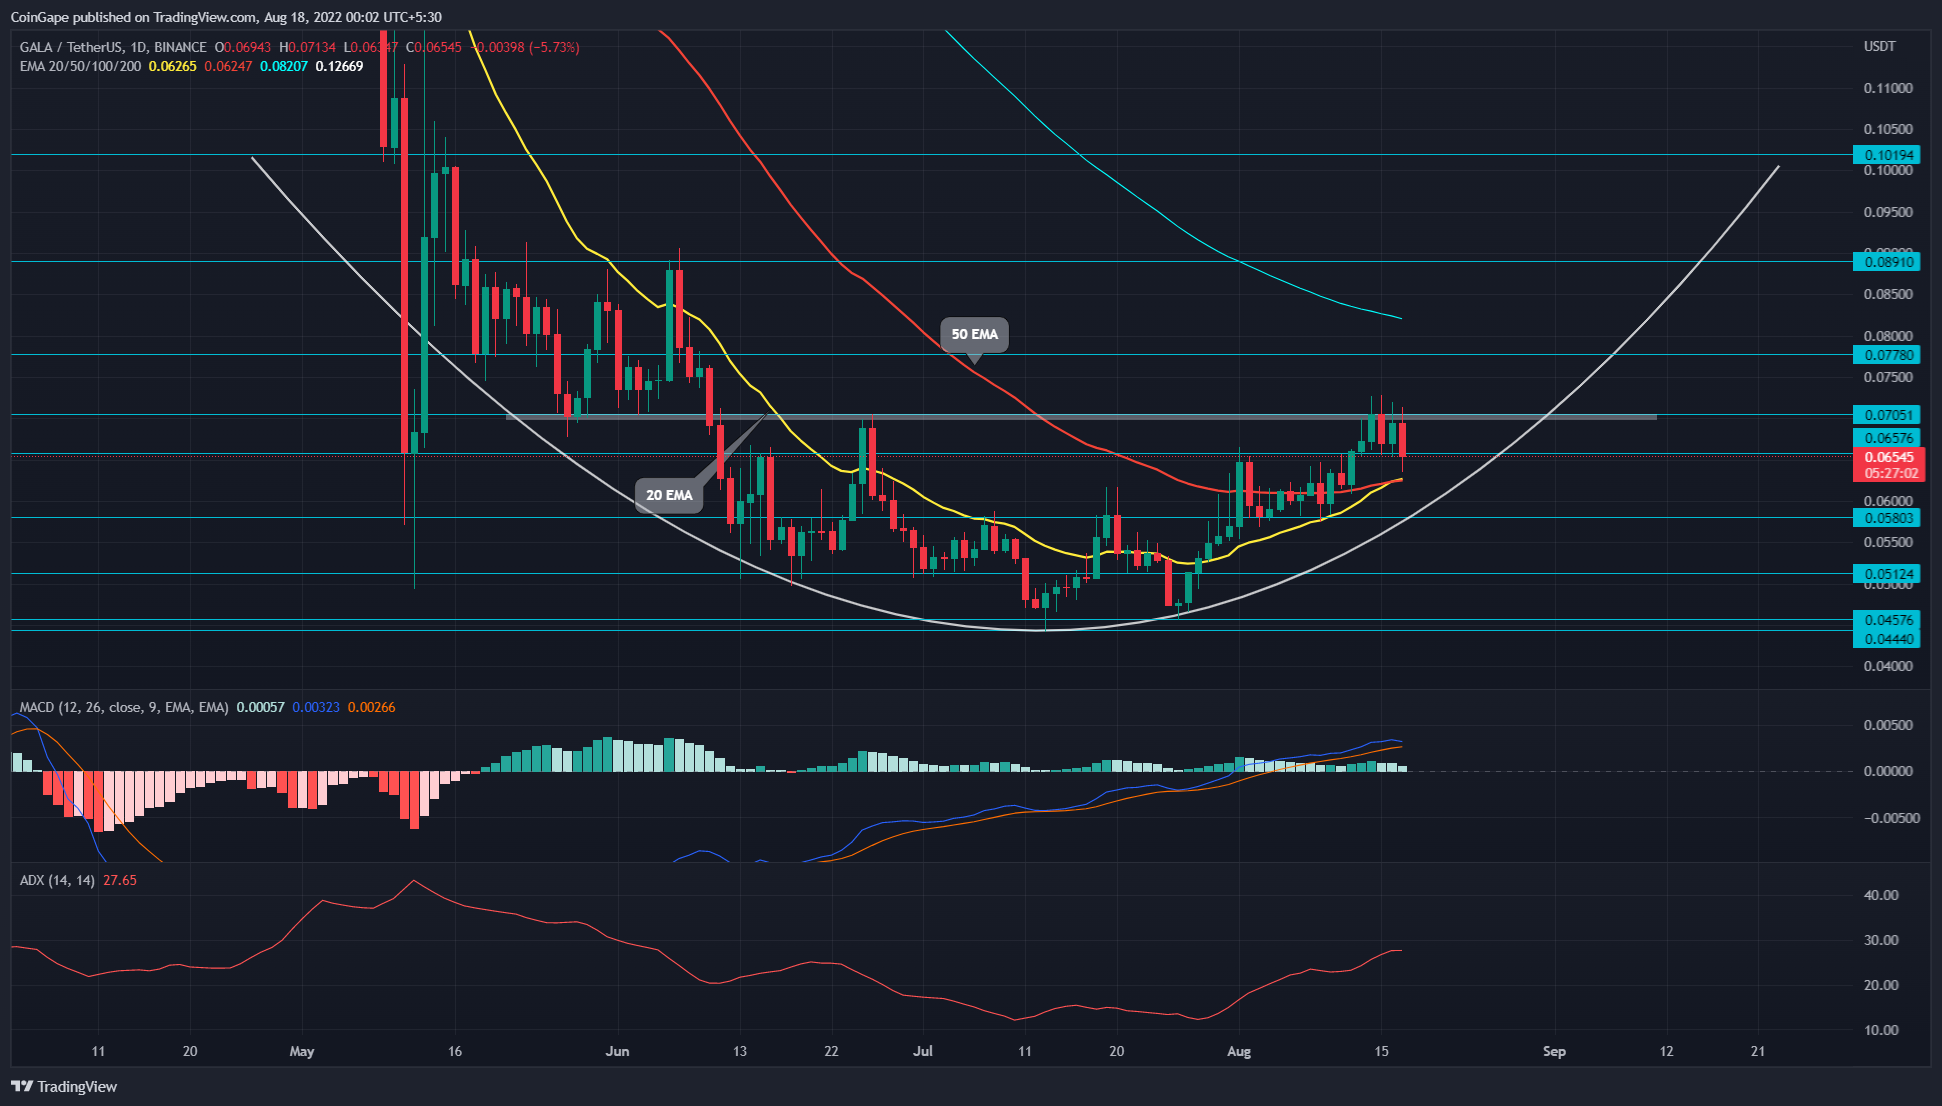
Source: Tradingview
The aforementioned resistance has limited the bullish growth for around two months now. Furthermore, the altcoin showed several attempts to breach the $0.0705 mark over the last four days but ended up falling with a long-wick rejection.
These higher price rejection candles indicate the traders are actively selling at this ceiling. Furthermore, today, the GALA price has dropped 6.16% and nosedived below minor support of $0.0656.
Trending Stories
A daily candlestick closing below the breached support would signal a longer price correction. The potential breakdown would slump the GALA price 10.5% down to reach the $0.058 support.
If the altcoin sustains above the mentioned support, the replenished bullish momentum may strike back the $0.07 with a better possibility to breakout above it.
In response to the bullish reversal pattern, such pullbacks offer sidelined buyers an opportunity and accelerate the buying pressure. The sustained buying should lead the GALA price 55% higher to reach the pattern’s neckline resistance of $0.1.
Technical Indicator
EMAs: a bullish crossover of the 20-and-50-day EMA at the $0.0626 mark could prevent the $0.0656 breakdown. Moreover, these EMAs slopes are turned into suitable support levels.
advertisement
MACD indicator: the fast and slow nearing a bearish crossover indicates the sellers’ attempt to wrestle trend control from buyers. However, these slopes moving above the neutral line indicate the buyers have the upper hand.
- Resistance level- $0.07 and $0.078
- Support level- $0.065 and $0.0588
Share this article on:
The presented content may include the personal opinion of the author and is subject to market condition. Do your market research before investing in cryptocurrencies. The author or the publication does not hold any responsibility for your personal financial loss.