Disclaimer: The information presented does not constitute financial, investment, trading, or other types of advice and is solely the writer’s opinion.
Fears that the Federal Reserve does not yet have inflation under control were confirmed over the past two days. Chair of the Federal Reserve Jerome Powell signaled further pain could be in store as the fight against inflation saw interest rates undergo yet another hike of 75 bps (0.75%).
This announcement saw indices such as the S&P 500 take a nose dive, and Bitcoin faced heavy selling pressure as well. Being a risk-on asset does not help the case of Bitcoin, and the narrative of “inflation hedge” has long since died out.
The short-term technical outlook suggested a move toward $17.8k could commence.
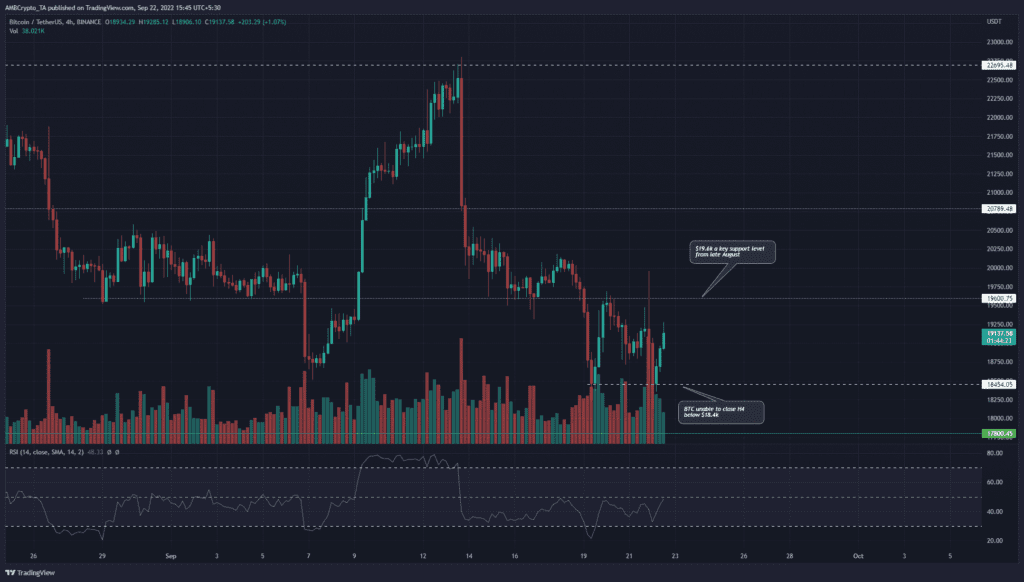
BTC- 4-Hour Chart
On the 4-hour chart, significant volatility was seen in September, but the price was unable to form new highs. The climb past $20.8k was impressive but the failure to follow through and break the $22.7k resistance meant the buyers had run out of steam.
The market quickly reversed and registered new lows at $18.4k.
A little more than ten days ago the structure flipped to bearish after BTC fell below the $21.2k mark. This structure remained unbroken and suggested further losses were likely.
The RSI on H4 was also below neutral 50. The neutral mark has acted as resistance multiple times over the past week and hinted that, at the time of writing, the momentum was still in favor of the sellers.
BTC- 1-Hour Chart

Source: BTC/USDT on TradingView
The bearish bias on a higher timeframe meant that the H1 bias for a trader can be bearish as well. This meant that we can look for opportunities to enter short positions. A bearish order block was formed the previous day, highlighted by the red box.
A set of Fibonacci retracement levels (yellow) were also drawn, and the area between 61.8% and 78.6% retracement levels could offer an entry to a short position.
The downside target would be the $17.8k support, which lay close to the $17.7k level (23.6% Fibonacci extension).
The OBV formed a lower low over the past few days and called attention to rising selling pressure. The RSI climbed above neutral 50 on the hourly chart but the bias can not be concluded to be bullish.
Conclusion
Invalidation of the bearish notion presented would be a session close above the $20k mark for Bitcoin. On the other hand, downside targets lie around the $17.8k mark. Further lows can not be discounted either in the weeks to come.